Grafici di superficie e a griglia
Rappresentare i dati su griglia come grafici di superficie e a griglia
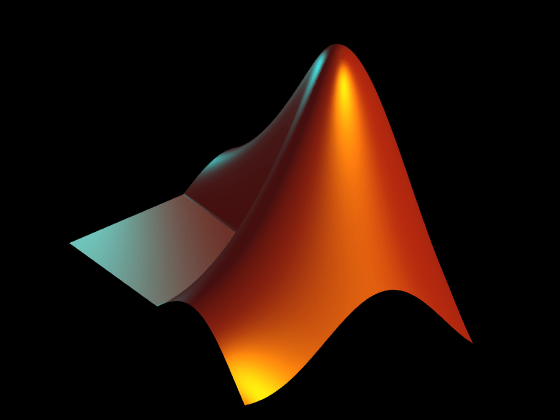
Visualizzare dati tridimensionali utilizzando grafici di superficie e a griglia. Creare superfici composte da facce e bordi di facce solidi o semitrasparenti e creare grafici a griglia che mostrano solo i bordi delle facce.
Funzioni
Proprietà
| Surface Properties | Chart surface appearance and behavior |
| Surface Properties | Primitive surface appearance and behavior |
| FunctionSurface Properties | Surface chart appearance and behavior |
| ImplicitFunctionSurface Properties | Implicit surface chart appearance and behavior |
| ParameterizedFunctionSurface Properties | Parameterized surface chart appearance and behavior |
Argomenti
- Creazione di grafici tridimensionali
Questo esempio mostra come creare una serie di grafici tridimensionali in MATLAB®.
- Changing Surface Properties
This example shows how to get properties of a surface plot in MATLAB® and change the property values to customize your plot.
- Representing Data as a Surface
You can visualize matrix data on a rectangular grid using surface plots.
- How Surface Plot Data Relates to a Colormap
Change the relationship between surface plot data and the colormap.
Informazioni complementari
Esempi in primo piano

You can also select a web site from the following list:
Americas
- América Latina (Español)
- Canada (English)
- United States (English)
Europe
- Belgium (English)
- Denmark (English)
- Deutschland (Deutsch)
- España (Español)
- Finland (English)
- France (Français)
- Ireland (English)
- Italia (Italiano)
- Luxembourg (English)
- Netherlands (English)
- Norway (English)
- Österreich (Deutsch)
- Portugal (English)
- Sweden (English)
- Switzerland
- United Kingdom (English)