maimage
Spatial image for microarray data
Syntax
maimage(X, FieldName)

H = maimage(...)

[H, HLines] = maimage(...)


maimage(..., 'PropertyName', PropertyValue,...)

maimage(..., 'Title', TitleValue)

maimage(..., 'ColorBar', ColorBarValue)

maimage(..., 'HandleGraphicsPropertyName' PropertyValue)
Arguments
X | A microarray data structure. |
FieldName | A field in the microarray data structure X. |
TitleValue | A character vector or string to use as the title for the plot. The
default title is FieldName. |
ColorBarValue | Property to control displaying a color
bar in the Figure window. Enter either true or false.
The default value is false. |
Description
maimage(
displays an image of field
X, FieldName)FieldName from
microarray data structure
X. Microarray data can
be GenPix Results (GPR) format. After creating the
image, click a data point to display the value and
ID, if known.
H = maimage(...) returns the handle of
the image.
[H, HLines] = maimage(...) returns the
handles of the lines used to separate the different blocks in the
image.
maimage(..., ' defines
optional properties using property name/value pairs.PropertyName', PropertyValue,...)
maimage(..., 'Title', allows
you to specify the title of the plot. The default title is TitleValue)FieldName.
maimage(..., 'ColorBar', ,
when ColorBarValue)ColorBarValue is true,
a color bar is shown. If ColorBarValue is false,
no color bar is shown. The default is for the color bar to be shown.
maimage(..., ' allows
you to pass optional Handle Graphics® property name/value pairs
to the function. For example, a name/value pair for color could be HandleGraphicsPropertyName' PropertyValue)maimage(...,
'color' 'r').
Examples
Read in a sample GPR file.
madata = gprread('mouse_a1wt.gpr');Plot the median foreground intensity for the 635 nm channel.
maimage(madata,'F635 Median')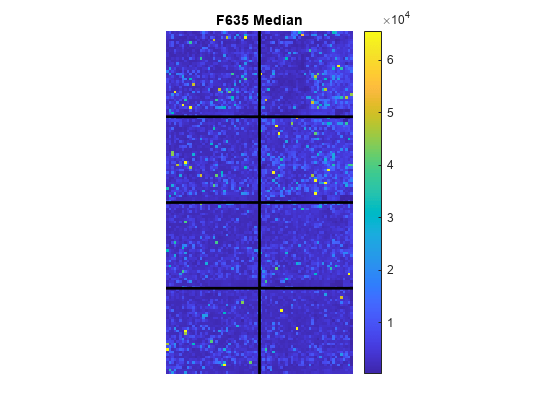
Alternatively, create a similar plot using more basic graphics commands.
F635Median = magetfield(madata,'F635 Median');
figure
imagesc(F635Median(madata.Indices));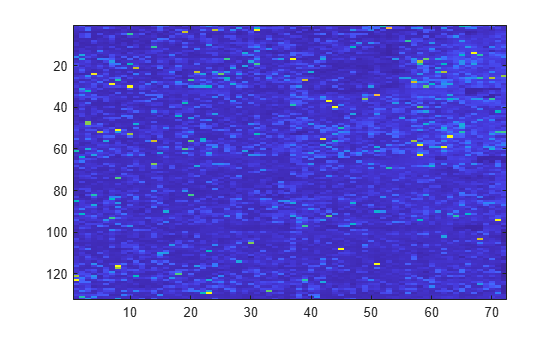
Change the colormap to one of the preset colors (for details, see map) and add a color bar.
colormap('bone')
colorbar 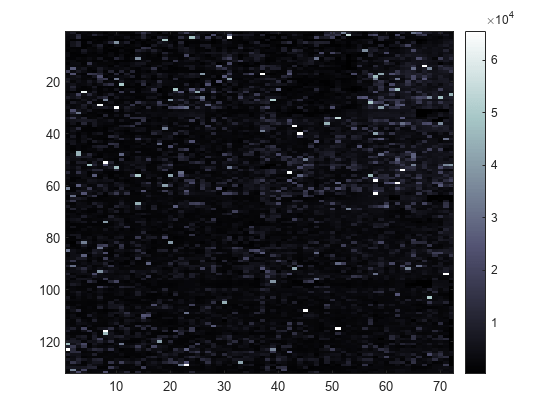
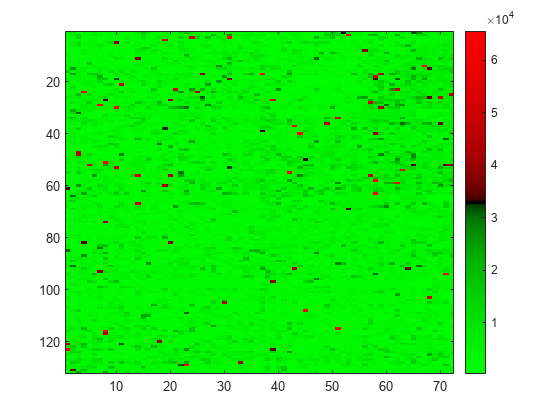
Change the colormap to red and green.
colormap(redgreencmap)
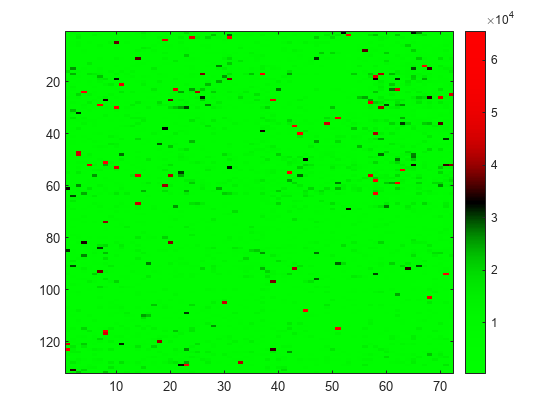
You can also change the color interpolation method.
colormap(redgreencmap(256,'Interpolation','cubic'))
Reset the colormap to the default value.
colormap('default')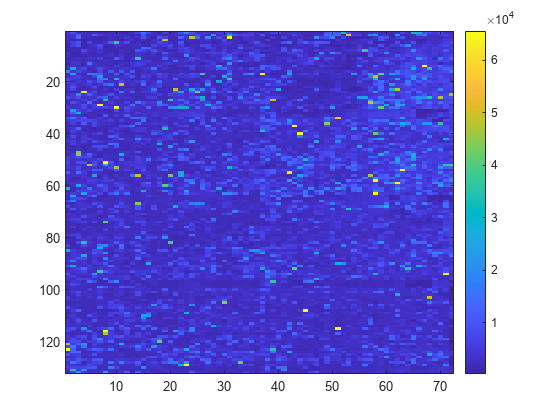
Version History
Introduced before R2006a