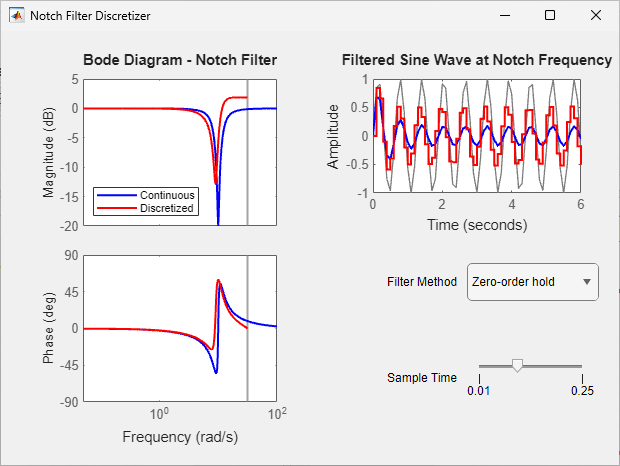
Notch Filter Discretizer App
The Notch Filter Discretizer app is an example of how you can add linear analysis response plots to your own custom apps. The app discretizes a continuous-time notch filter using a user-specified discretization method and sample time. It then plots the frequency responses of the filters along with a time-domain simulation of the filters.
For an example of how to create such apps, see Create App with Linear Analysis Response Plots.

To run the app, type the following command.
NotchFilterDiscretizer
Filter Configuration
The app includes a drop-down list to select one of the following discretization methods. The app uses the c2d function to discretize the continuous-time filter.
Zero-order hold
Tustin
Prewarped Tustin
Matched pole/zero
The user can specify a sample time for the discrete-time filter using a slider.
Response Plots
The app displays the plots for the filter frequency responses and a time-domain simulation of the filters. The app initialization code creates the plots using the plotting functions that create chart objects that you can modify using dot notation. Both chart objects are stored as properties of the app.
The filter frequency responses are plotted using the
bodeplotfunction.The time-domain simulation is plotted using the
lsimplotfunction.
When the user modifies the filter method or sample time, the app computes a new discrete-time filter updates the model source data for the response plots. For example, the following code updates the model, input signal, and time vector for the discrete-time filter, which is the second response in the plot. Here, lp is the chart object for the linear simulation plot, sysD is the discretized filter model, and t is a simulation time vector with step size equal to the sample time.
app.lp.Responses(2).SourceData.Model = app.sysD;
app.lp.Responses(2).SourceData.Time = t;
app.lp.Responses(2).SourceData.InputSignal = sin(10*t);
Once the app modifies the model source data for a chart object, the corresponding response plot updates.
See Also
App
Designer | bodeplot | lsimplot