Selecting Response Types
Methods for Selecting Response Types
There are two methods for selecting response plots in the Linear System Analyzer:
Selecting Plot Type from the right-click menus
Opening the Plot Configurations window
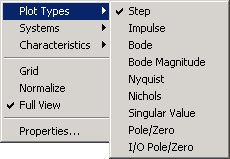
Right Click Menu: Plot Type
If you have a plot open in the Linear System Analyzer, you can switch to any other response plot available by selecting Plot Type from the right click menu.

To change the response plot, select the new plot type from the Plot Type submenu. The Linear System Analyzer automatically displays the new response plot.
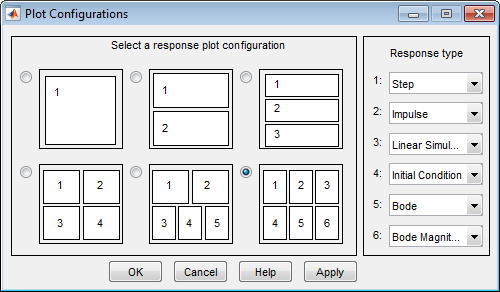
Plot Configurations Window
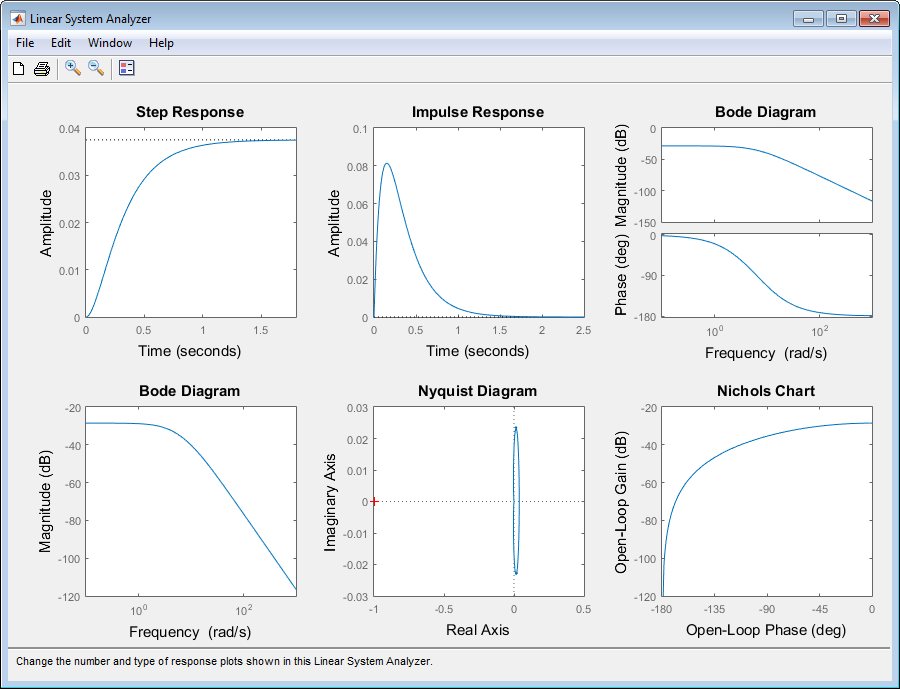
The Plot Type feature of the right-click menu works on existing plots, but you can also add plots to a Linear System Analyzer by using the Plot Configurations window. By default, the Linear System Analyzer opens with a closed-loop step response. To reconfigure an open viewer, select Plot Configuration in the Edit menu.

Use the radio buttons to select the number of plots you want displayed in your Linear System Analyzer. For each plot, select a response type from the menus located on the right-hand side of the window.
It's possible to configure a single Linear System Analyzer to contain up to six response plots.

Available response plots include: step, impulse, Bode (magnitude and phase, or magnitude only), Nyquist, Nichols, sigma, pole/zero maps, and I/O pole/zero maps.
Line Styles Editor
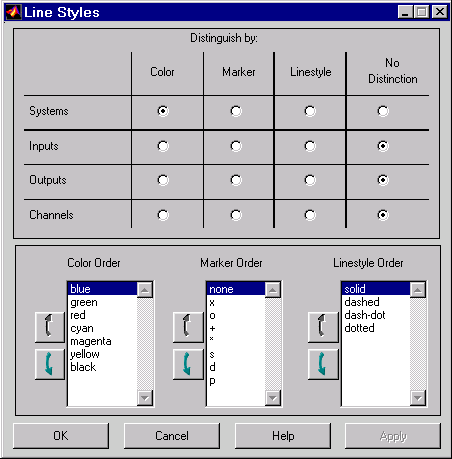
Select Edit > Line Styles to open the Line Styles editor.

The Line Styles editor is particularly useful when you have multiple systems imported. You can use it change line colors, add and rearrange markers, and alter line styes (solid, dashed, and so on).
You can use the Linestyle Preferences window to customize the appearance of the response plots by specifying:
The line property used to distinguish different systems, inputs, or outputs
The order in which these line properties are applied
Each Linear System Analyzer has its own Linestyle Preferences window.
Setting Preferences
You can use the "Distinguish by" matrix (the top half of the window) to specify the line property that will vary throughout the response plots. You can group multiple plot curves by systems, inputs, outputs, or channels (individual input/output relationships). Note that the Line Styles editor uses radio buttons, which means that you can only assign one property setting for each grouping (system, input, etc.).
Ordering Properties
The Order field allows you to change the default property order used when applying the different line properties. You can reorder the colors, markers, and linestyles (e.g., solid or dashed).
To change any of the property orders, click the up or down arrow button to the left of the associated property list to move the selected property up or down in the list.