Perform Flash/No-flash Denoising with Guided Filter
R2026bThis example shows how to use a guided filter to smooth an image, reducing noise, while preserving edges. The example uses two pictures of the same scene, one taken with a flash and the other without a flash. The version without a flash preserves colors but is noisy due to the low-light conditions. This example uses the version taken with a flash as the guidance image.
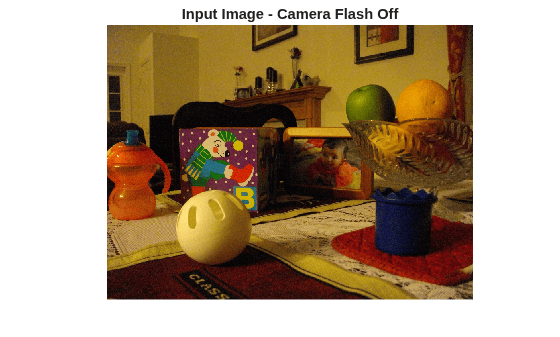
Read the image that you want to filter into the workspace. This example uses an image of some toys taken without a flash. Because of the low light conditions, the image contains a lot of noise.
A = imread("toysnoflash.png");
figure
imshow(A)
title("Input Image - Camera Flash Off")
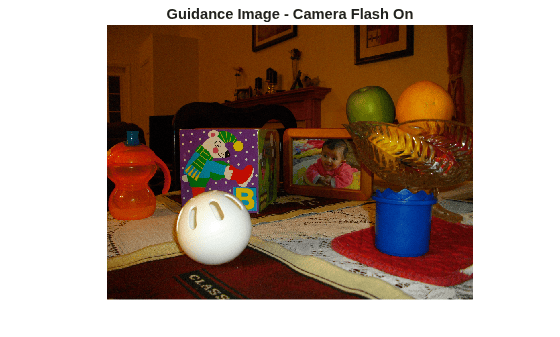
Read the image that you want to use as the guidance image into the workspace. In this example, the guidance image is a picture of the same scene taken with a flash.
G = imread("toysflash.png");
figure
imshow(G)
title("Guidance Image - Camera Flash On")
Perform the guided filtering operation. Using the imguidedfilter function, you can specify the size of the neighborhood used for filtering. The default is a 5-by-5 square. This example uses a 3-by-3 neighborhood. You can also specify the amount of smoothing performed by the filter. The value can be any positive number. One way to approach this is to use the default first and view the results. If you want less smoothing and more edge preservation, use a lower value for this parameter. For more smoothing, use a higher value. This example sets the value of the smoothing parameter.
nhoodSize = 3;
smoothValue  = 0.001*diff(getrangefromclass(G)).^2;
B = imguidedfilter(A,G,NeighborhoodSize=nhoodSize,DegreeOfSmoothing=smoothValue);
figure
imshow(B)
title("Filtered Image")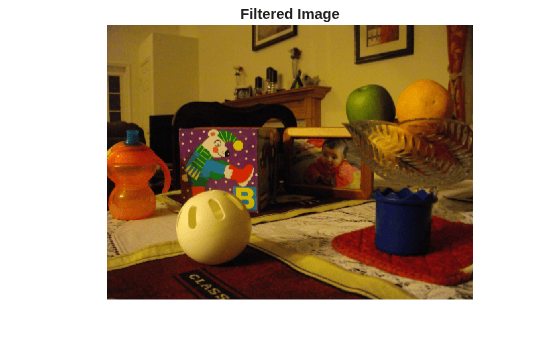
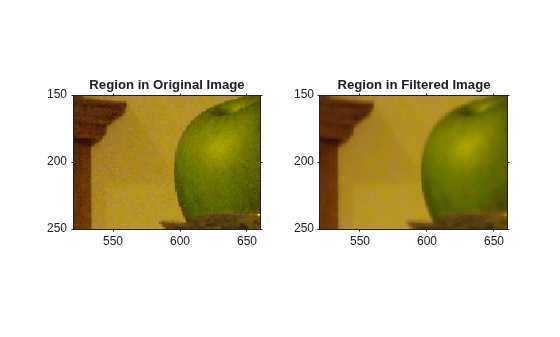
Examine a close up of an area of the original image and compare it to the filtered image to see the effect of this edge-preserving smoothing filter.
figure
h1 = subplot(1,2,1);
imshow(A)
title("Region in Original Image")
axis on
h2 = subplot(1,2,2);
imshow(B)
title("Region in Filtered Image")
axis on
linkaxes([h1 h2])
xlim([520 660])
ylim([150 250])