EncircledEnergyChart
R2026bDescription
Add-On Required: This feature requires the Optical Design and Simulation Library for Image Processing Toolbox add-on.
An EncircledEnergyChart object plots encircled energy curves
derived from one or more point spread function (PSF) result objects.
Use an EncircledEnergyChart chart to visualize the percentage of total
PSF energy enclosed within a radius for selected wavelength channels and field points.
Creation
Create an EncircledEnergyChart object by using the showEncircledEnergy object function of a GeometricPSF or
HuygensPSF object. Create a PSF result object by using the psf object
function.
hEE = showEncircledEnergy(psfr)
You can specify chart properties when you call
showEncircledEnergy.
hEE = showEncircledEnergy(psfr,WavelengthIndices=[1 3],Grid="major")Properties
Examples
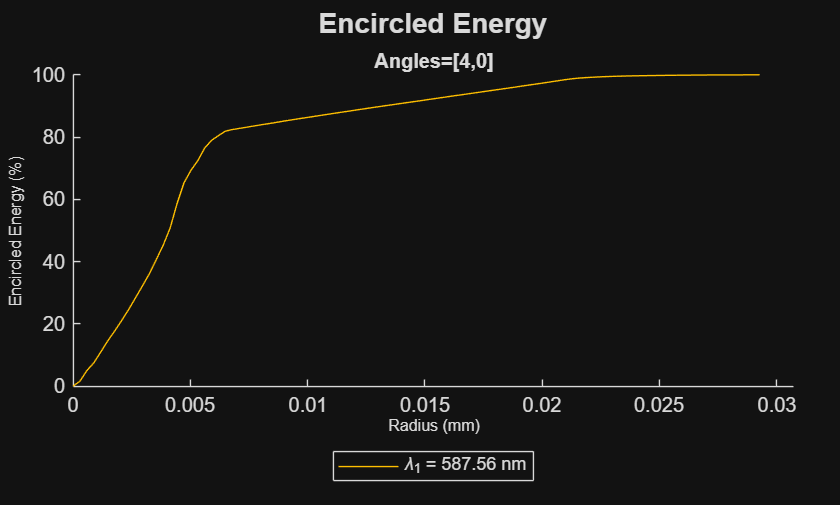
Load the sample Double Gauss lens system using zmximport. Define a field point at an angle of 4 degrees along the x-axis, specify a wavelength of 587.56 nm, and calculate the geometric PSF.
opsys = zmximport("DoubleGaussLens.zmx");
fp = fieldPoint(Angles=[4 0]);
lambda = 587.56;
psfr = psf(opsys, FieldPoints=fp, Wavelengths=lambda, Method="Geometric");
Visualize the fraction of total energy enclosed within a given radius using the showEncircledEnergy function. The function renders the distribution curve and returns a chart handle for further property customization.
hEE = showEncircledEnergy(psfr)
hEE =
  EncircledEnergyChart with properties:

               Legend: on
                 Grid: "off"
                Title: "Encircled Energy"
                  PSF: [1×1 optics.result.GeometricPSF]
    WavelengthIndices: 1
                Color: [1 0.7478 0]
             Position: [0.0869 0.2349 0.8581 0.6159]
                Units: 'normalized'

  Show all properties
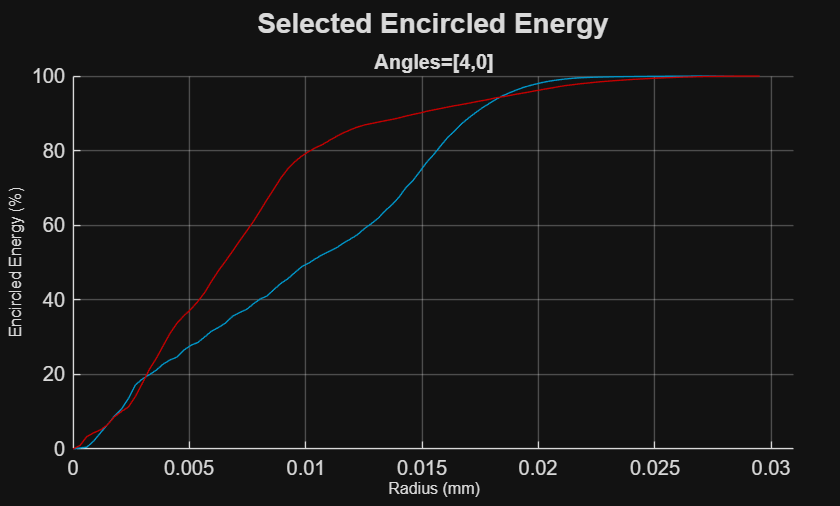
Load the sample Double Gauss lens system using zmximport. Define a field point at an angle of 4 degrees along the x-axis and specify an array of three wavelengths (486.13 nm, 587.56 nm, and 656.28 nm).
opsys = zmximport("DoubleGaussLens.zmx");
fp = fieldPoint(Angles=[4 0]);
lambdas = [486.13 587.56 656.28];
Compute the Huygens PSF across all specified wavelengths by setting the Method name-value argument to "Huygens". Use the showEncircledEnergy function to plot the energy curves for only the first and third wavelengths, and add a major grid to the display. Modify the Title and Legend properties of the returned chart object to update the title text and hide the legend.
psfr = psf(opsys, FieldPoints=fp, Wavelengths=lambdas, Method="Huygens");
hEE = showEncircledEnergy(psfr, WavelengthIndices=[1 3], Grid="major");
hEE.Title = "Selected Encircled Energy";
hEE.Legend = "off";
More About
Version History
Introduced in R2026b
See Also
showEncircledEnergy | encircledEnergyAtRadius | radiusAtEncircledEnergy | psf | GeometricPSF | HuygensPSF

