Calculate C/C++ Code Profiling Metrics in Polyspace Platform User Interface
Using Polyspace® Test™, you can calculate C/C++ code profiling metrics, such as code coverage, execution time, and memory use:
The metric
Code Coveragemeasures how much of your code is covered by existing test cases.The metric
Execution Timecomputes the time required to execute the different callable entities of your code.The metric
Memory Usemeasures how the callable entities use the available stack memory.
The steps for calculating code profiling metrics depend on your test authoring workflow:
If you author tests by using the Polyspace Test xUnit API, you can calculate code coverage by using your own toolchain with the
polyspace-code-profilercommand.If you create your tests graphically in the Polyspace Platform user interface using a project or add your xUnit tests to a project, you can calculate code coverage in the user interface or automate the code coverage calculation using the
polyspace-testcommand
This example shows how to calculate the code profiling metrics in the Polyspace Platform user interface. In this workflow, you require a Polyspace Test project.
Configure Project
To calculate code profiling metrics using the Polyspace Platform user interface, you require a Polyspace
Test project (.psprjx) file containing C/C++ source files and corresponding tests. To follow this example, find the file example.c in the folder <polyspaceroot>\polyspace\examples\doc_pstest\coverage_data_collection\src and add the source file to your project.
To calculate the code profiling metrics of your tests, you require at least one test case. Analyze the source file and add these test cases:
foo(2,0)==2bar(1,1,0)==0bar(1,1,1)==1bar(1,0,1)==1bar(0,1,1)==1
For details about creating a project, adding source files, and creating tests graphically, see Write C/C++ Unit Tests in Polyspace Platform User Interface.
Calculate Code Profile Metrics
To calculate code coverage, execution time, or memory use metrics:
Open your project in the Polyspace Platform user interface. Add source files and test cases as necessary.
In the Profiling section on the Polyspace Platform toolstrip, instead of No Profiling, select one of Code Coverage, Execution Time, or Memory Use.
On the Projects pane, double-click the Configuration node of your project and open the project configuration. On the Configuration pane, set the following options as needed on the Testing & Profiling tab:
On the All Profiling node, specify files and folders that must be ignored during profiling. Alternatively, you can choose to limit code profiling to specific folders only.
On the Code Coverage node, specify which code coverage metrics you want to calculate. For example, to enable decision, condition, and MCDC coverage, select
MC/DCfor the optionCoverage metrics (-cov-metric-level).
Build your project by clicking Build Project on the toolstrip. Polyspace Test generates the databases and other intermediate files that are necessary to calculate the code profiling metrics.
Click Run Tests to run the test and generate profiling metrics.
After the tests complete, on the Results pane, you see the following nodes:
Tests node containing test execution results.
One of the nodes, Coverage, Execution Profiling, or Memory Profiling, containing code profiling results.
Right-click the node containing code profiling results and select Open Review.
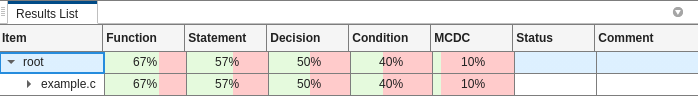
Review the results. For example, review the code coverage of the five added tests:
For more information about reviewing code coverage results, see:
The Polyspace Platform user interface does not support viewing the execution time and memory use metrics. When you open these results in the Polyspace Platform user interface, the results are converted into an HTML report. After you specify a folder to save the report, the report opens automatically in your default web browser.
You can also upload the results to Polyspace Access. See Upload Results to Polyspace Access.
Each time you update your code or tests, rebuild the project to obtain correct code profiling results.