Structure of HTML Reports Generated from C/C++ Code Sanitizer Results
Using Polyspace® Test™, you can export code sanitizer profiling results to HTML reports for archiving and certification. This topic walks through the structure of an HTML report generated from C/C++ code sanitization results.
For more information on code sanitizing and how to generate the sanitizer profiling report, see Run C/C++ Code Sanitizer and Review Results in Polyspace Platform User Interface.
Organization of Reports
When you generate an HTML report in the user interface, the generated report opens automatically in your default web browser. To open reports outside this context, navigate to the folder where you generated the reports.
The report folder contains the following HTML files:
index.html— This file contains the sanitizer profiling summary report which shows the number of expressions analyzed per file, expressions that caused errors during test execution (failed) and ones that did not (passed).File-specific HTML reports containing the details of analyzed expressions per function and expression.
Code Sanitizer Summary Report
The code sanitizer summary report consists of the following sections.
Product and Version
The Product and Version section contains information about when the report was generated and the Polyspace Test product version that was used to generate the results and the report.
Analysis Information
This section describes options used to perform code sanitizer profiling. For instance, if you generate the sanitizer profiling report using a project in the Polyspace Platform user interface, this section consists of the following parts:
File Information — Includes the last modified time, file size, and a MD5 checksum.
Project Information — Lists project path, project author, and so on.
Environment Information — Lists build configuration name, toolchain used for building the project, and so on.
Aggregated Tests — Lists the names of tests that were run in order to generate the code sanitizer profiling report.
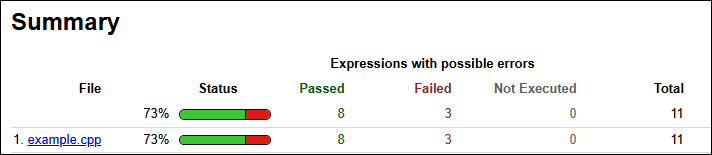
Summary
This section provides a summary of sanitizer profiling results per file. For each file, the summary is displayed in the following columns:
Status: Percentage of expressions that did not cause an error during test execution. This information is also represented visually as a status bar.
Passed: Number of expressions that did not cause an error during test execution.
Failed: Number of expressions that caused an error during test execution.
Not Executed: Number of expressions that were not evaluated during test execution.
Total: Number of expressions identified as potential failure points and instrumented by the code sanitizer.
For instance, the following snapshot of the summary section of a report shows that 11 expressions were instrumented by the code sanitizer, of which 3 expressions caused an error during test execution.
Code Sanitizer Detailed Report per File
The detailed code sanitizer report for each source file consists of the following sections.
Analysis Information
This section has the following parts:
File Information: Lists last time when the file was modified, file size and so on.
Aggregated Tests: Lists names of tests that evaluated expressions in the file along with their short names. In the later part of the report, each test is referred by its short name. If you click on the short name, you navigate to this section that maps short names to actual test names.
Summary
This section has the same information as the code sanitizer summary report, but the information is now broken down by function instead of file. For each function, the summary is displayed in the following columns:
Status: Percentage of expressions that did not cause an error during test execution. This information is also represented visually as a status bar.
Passed: Number of expressions that did not cause an error during test execution.
Failed: Number of expressions that caused an error during test execution.
Not Executed: Number of expressions that were not evaluated during test execution.
Total: Number of expressions identified as potential failure points and instrumented by the code sanitizer.
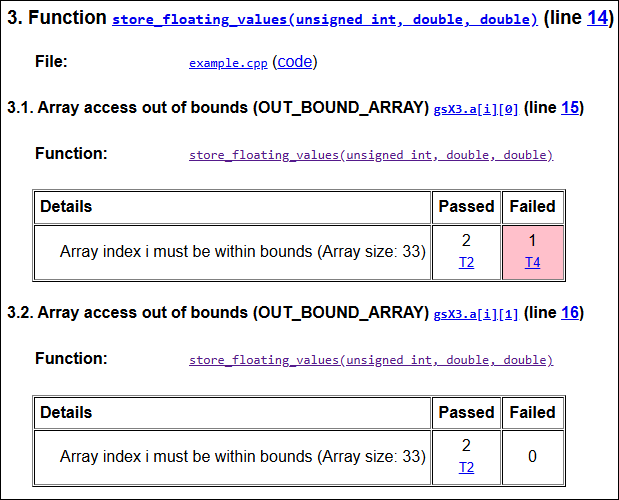
Details
This section lists all expressions that were flagged as potential failure points and instrumented by the code sanitizer. For each expression, this section lists:
The error that the expression might cause.
Number of tests that showed this error (with one example if it exists).
Number of tests that did not show this error (with one example if it exists).
For example, the following section of a sanitizer report shows that the function store_floating_values() contains two array accesses that were flagged as potential candidates for array access out bounds:
gsX3.a[i][0]: The array access out of bounds did not occur in the 2 tests where the array was accessed but did occur in 1 test. You can click on the short nameT4to navigate to the full name of the test.gsX3.a[i][1]: The array access out of bounds did not occur in the 2 tests where the array was accessed.