Create a Report with Landscape Pages
This example shows how to create a report with landscape pages that are 11 inches wide and 8.5 inches high. Using landscape pages allows fitting content that is too wide to fit on a portrait page, such as side-by-side images depicted here.
Import the DOM and Report API packages so that you do not have to use long, fully qualified class names.
import mlreportgen.dom.*;
import mlreportgen.report.*;
Create a container for a PDF report. To create a Word report, change the output type from "pdf" to "docx".
rpt = Report("figureSnapshotSideBySideLandscape","pdf");
Set the report landscape layout to true. This sets the entire report layout to landscape.
rpt.Layout.Landscape = true;
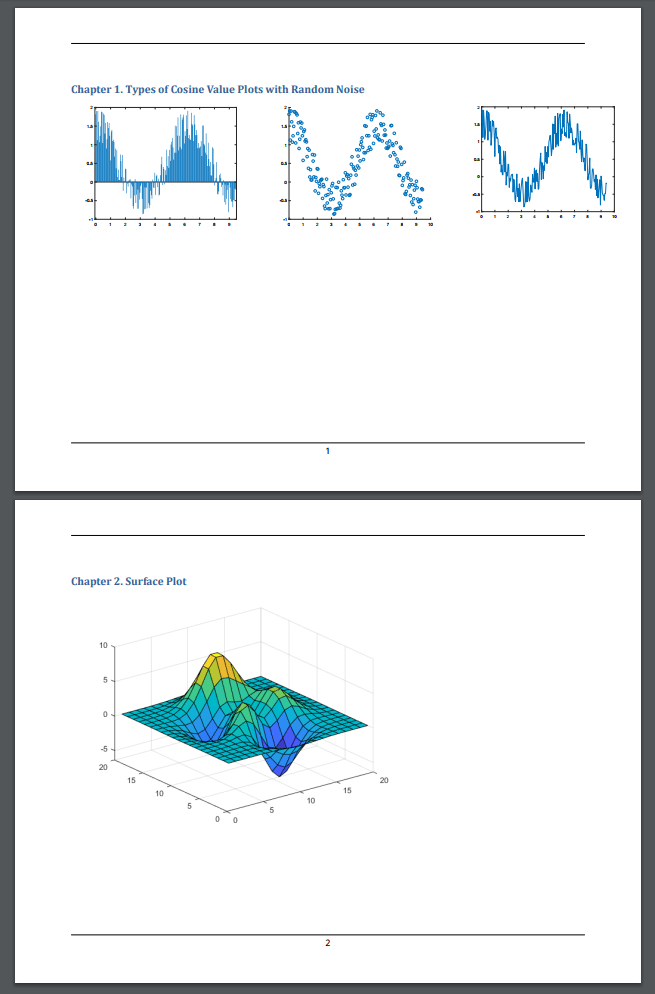
Create a chapter with the title "Types of Cosine Value Plots with Random Noise".
chapter = Chapter("Title", "Types of Cosine Value Plots with Random Noise");
Create the variables to plot. Create x as 200 equally spaced values between 0 and 3pi. Create y as cosine values with random noise.
x = linspace(0,3*pi,200);
y = cos(x) + rand(1,200);
Create figure objects of the x and y values: bar graph (fig1), scatter plot (fig2) and 2-D Line plot (fig3).
Create image objects wrapped around the figure snapshot image files. Set the scaling of the figure objects so they fit in the table entries.
imgStyle = {ScaleToFit(true)};

fig1 = Figure(bar(x, y));
fig1Img = Image(getSnapshotImage(fig1, rpt));
fig1Img.Style = imgStyle;
delete(gcf);

fig2 = Figure(scatter(x,y));
fig2Img = Image(getSnapshotImage(fig2, rpt));
fig2Img.Style = imgStyle;
delete(gcf);


fig3 = Figure(plot(x,y));
fig3Img = Image(getSnapshotImage(fig3, rpt));
fig3Img.Style = imgStyle;
delete(gcf);
Insert the images in the only row of a 1x5 invisible layout table(lo_table)(space between figures by having 2 empty table entries). A table is considered invisible when the borders are not defined for the table nor any of its table entries. The images are sized to fit the table entries only if the height and width of table entries are specified.
lo_table = Table({fig1Img, ' ', fig2Img, ' ',fig3Img});
lo_table.entry(1,1).Style = {Width('3.2in'), Height('3in')};
lo_table.entry(1,2).Style = {Width('.2in'), Height('3in')};
lo_table.entry(1,3).Style = {Width('3.2in'), Height('3in')};
lo_table.entry(1,4).Style = {Width('.2in'), Height('3in')};
lo_table.entry(1,5).Style = {Width('3in'), Height('3in')};
Add the table to the chapter and the chapter to the report.
add(chapter, lo_table);
add(rpt, chapter);
Create a chapter with the title "Surface Plot".
chapter1 = Chapter("Title", "Surface Plot");
Create a figure object for surface plot (fig4). Create image objects wrapped around the figure snapshot image files.
fig4 = Figure(surf(peaks(20)));
fig4Img = Image(getSnapshotImage(fig4, rpt));
fig4Img.Style = imgStyle;
delete(gcf);
Add the generated image object to the chapter and the chapter to the report.
add(chapter1, fig4Img);
add(rpt, chapter1);
Generate and display the report.
close(rpt);
rptview(rpt);
The generated report includes the side-by-side figure snapshots and the surface plot on landscape pages. The generated side-by-side figure snapshots are clearly legible.