Cross-Correlation with Multichannel Input
R2026bGenerate three 11-sample exponential sequences given by , , and , with . Use stem3 to plot the sequences side by side.
N = 11;
n = (0:N-1)';

a = 0.4;
b = 0.7;
c = 0.999;

xabc = [a.^n b.^n c.^n];

stem3(n,1:3,xabc',"filled")
ax = gca;
ax.YTick = 1:3;
view(37.5,30)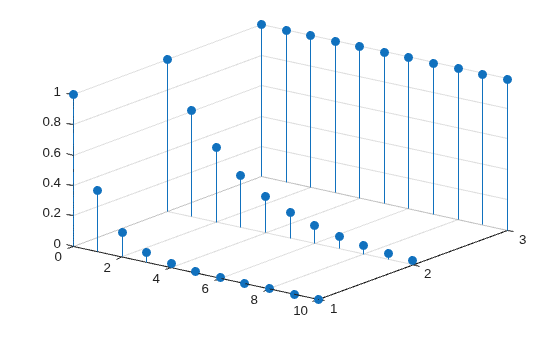
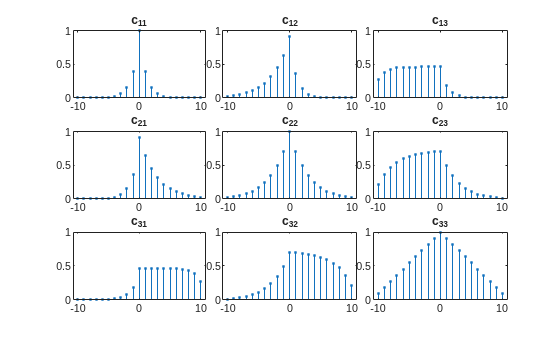
Compute the autocorrelations and mutual cross-correlations of the sequences. Output the lags so you do not have to keep track of them. Normalize the result so the autocorrelations have unit value at zero lag.
[cr,lgs] = xcorr(xabc,"coeff");

tiledlayout(3,3,TileSpacing="tight")
for row = 1:3
    for col = 1:3
        nm = 3*(row-1)+col;
        nexttile
        stem(lgs,cr(:,nm),".")
        title("c_{" + row + col  + "}")
        ylim([0 1])
    end
end
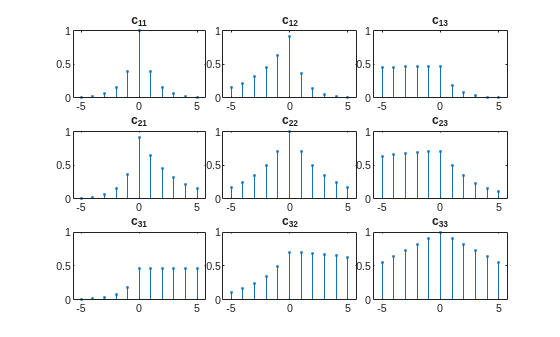
Restrict the calculation to lags between and .
[cr,lgs] = xcorr(xabc,5,"coeff");

tiledlayout(3,3,TileSpacing="tight")
for row = 1:3
    for col = 1:3
        nm = 3*(row-1)+col;
        nexttile
        stem(lgs,cr(:,nm),".")
        title("c_{" + row + col  + "}")
        ylim([0 1])
    end
end
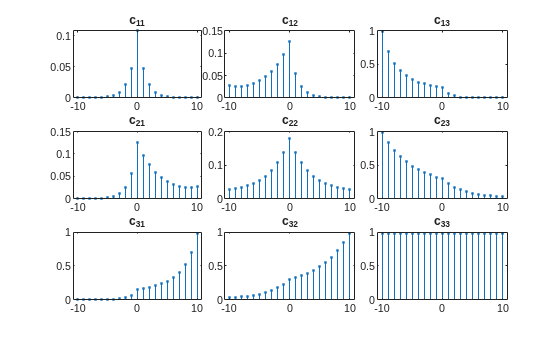
Compute unbiased estimates of the autocorrelations and mutual cross-correlations. By default, the lags run between and .
cu = xcorr(xabc,"unbiased");

tiledlayout(3,3,TileSpacing="tight")
for row = 1:3
    for col = 1:3
        nm = 3*(row-1)+col;
        nexttile
        stem(-(N-1):(N-1),cu(:,nm),".")
        title("c_{" + row + col  + "}")
    end
end