Simulink Real-Time TET Monitor
Monitor task execution time for the real-time application running on target computer
Since R2020b
Description
Simulink® Real-Time™ Task Execution Time (TET) Monitor lets you view the task execution time for the real-time application running on target computer.
You can open the TET monitor at any time. Depending on the current state of connected target computers, the monitor displays TET data for each real-time application task. Changes to the target computer state are updated in the TET monitor.
Open the Simulink Real-Time TET Monitor App
From the Simulink Editor, in the Real-Time tab, select TET Monitor. Or, from the MATLAB® Command Window, type:
slrtTETMonitor
Examples
Open TET Monitor and View Status
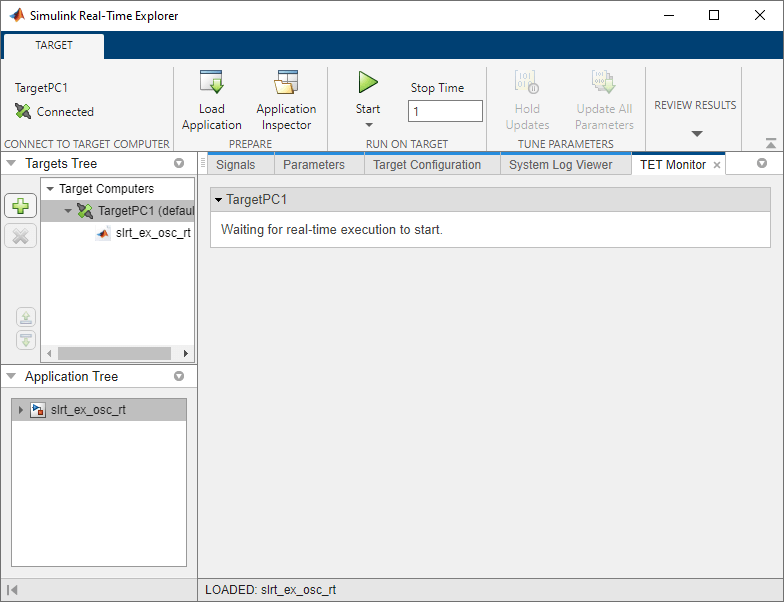
In the Data Logging with Simulation Data Inspector (SDI) example, use these additional steps to display the TET monitor.
Open the
slrt_ex_oscmodel.Build the real-time application, load it on the target computer, and start the application. In Simulink Editor Real-Time tab, click Run on Target.
Open the TET monitor. In the Real-Time tab, click TET Monitor. Or, in the Command Window, enter:
slrtTETMonitor
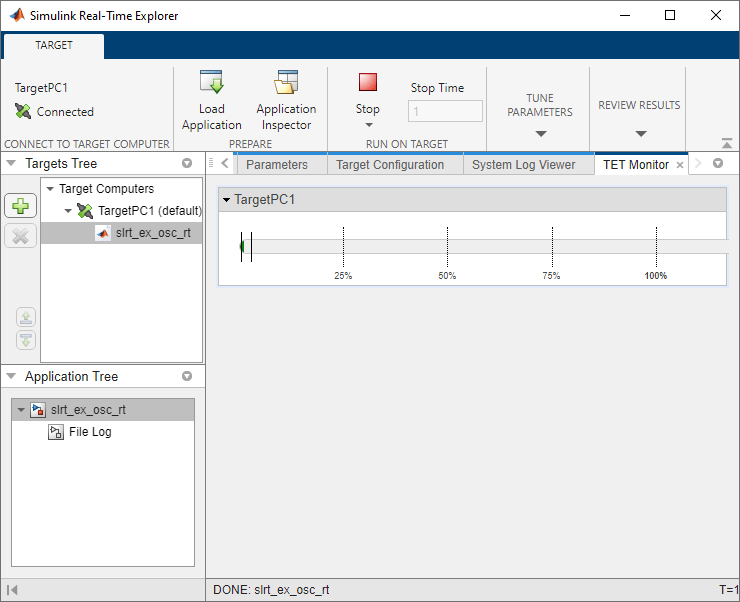
When you run the real-time application, the TET monitor displays status.
Programmatic Use
Version History
Introduced in R2020bSee Also
You can also select a web site from the following list:
Americas
- América Latina (Español)
- Canada (English)
- United States (English)
Europe
- Belgium (English)
- Denmark (English)
- Deutschland (Deutsch)
- España (Español)
- Finland (English)
- France (Français)
- Ireland (English)
- Italia (Italiano)
- Luxembourg (English)
- Netherlands (English)
- Norway (English)
- Österreich (Deutsch)
- Portugal (English)
- Sweden (English)
- Switzerland
- United Kingdom (English)