Predict Class Labels Using ClassificationXGBoost Predict Block
R2026bThis example shows how to use the ClassificationXGBoost Predict block for label prediction in Simulink®. The block accepts an observation (predictor data), and returns the predicted class label and class score for the observation using the trained XGBoost classification model.
The ClassificationXGBoost Predict block requires a pretrained XGBoost model that you import to MATLAB® using the importModelFromXGBoost function. This example provides the pretrained model file, which was trained in Python® and saved as a JSON file using model.save_model('trainedXGBoostModel.json').
Create Simulink Model
Import the pretrained model using the importModelFromXGBoost function.
modelfile = "trainedXGBoostModel.json";
xgbMdl = importModelFromXGBoost(modelfile)
xgbMdl =
CompactClassificationXGBoost
ResponseName: 'Y'
ClassNames: [0 1]
ScoreTransform: 'logit'
NumTrained: 30
ImportedModelParameters: [1×1 struct]
Properties, Methods
Create a new model using the ClassificationXGBoost Predict block. To create a new Simulink model, open the Blank Model template and add the ClassificationXGBoost Predict block from the Statistics and Machine Learning Toolbox™ library.
Double-click the ClassificationXGBoost Predict block to open the Block Parameters dialog box. Import a trained ClassificationXGBoost model into the block by specifying the name of a workspace variable that contains the model. The default variable name is xgbMdl, which is the model you imported.
Click the Refresh button to refresh the settings of the trained model in the dialog box. The Trained Machine Learning Model section displays the options used to train the model xgbMdl. Select the check boxes Add output port for predicted class scores check box to add the second (score) output port in the block.
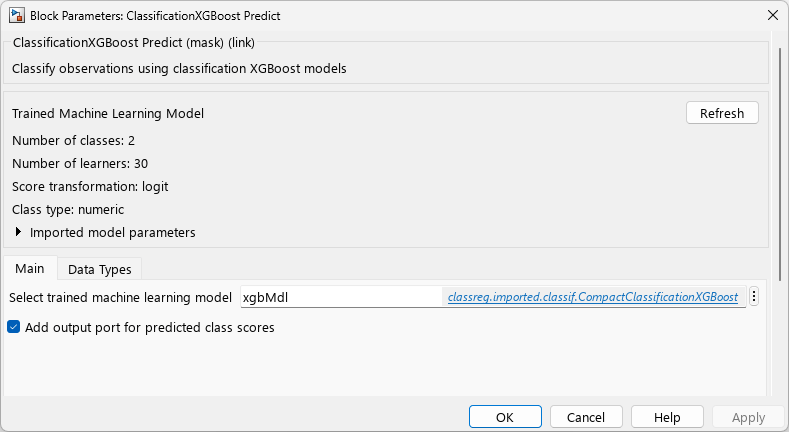
Add one Inport block and two Outport blocks, and connect them to the ClassificationXGBoost Predict block. The block expects an observation containing 34 predictor values. Double-click the Inport block, and set the Port dimensions to 34 on the Signal Attributes tab. To specify that the output signals have the same length as the input signal, set Sample time to 1 on the Execution tab of the Inport dialog box. Click OK.
At the command line, load the ionosphere data set, which was used to train the XGBoost classification model. Convert the response data to a logical array to match the imported model.
load ionosphere
Y = (Y=="g");
To simulate new observations that differ from those used to train the XGBoost model, add random Gaussian noise to the observations.
rng("default")
X = X + 0.1*randn(size(X));
Create an appropriate structure array for the input data. For more information, see Control How Models Load Input Data (Simulink).
modelInput.time = (1:size(X,1))'-1;
modelInput.signals.values = X;
modelInput.signals.dimensions = size(X,2);
To import signal data from the workspace:
Open the Configuration Parameters dialog box. On the Modeling tab, click Model Settings.
In the Data Import/Export pane, select the Input check box and enter
modelInputin the adjacent text box.In the Solver pane, under Simulation time, set Stop time to
modelInput.time(end). Under Solver selection, set Type toFixed-step, and set Solver todiscrete (no continuous states). These settings enable the model to run the simulation for each query point inmodelInput. Click OK.
For more details, see Load Signal Data for Simulation (Simulink).
Save the model as slexClassificationXGBoostPredict.slx in Simulink.
Simulate Model
Simulate the Simulink model. When the Inport block detects an observation, it places the observation into the ClassificationXGBoost Predict block. You can use the Simulation Data Inspector (Simulink) to view the logged data of the Outport block.
simOut = sim("slexClassificationXGBoostPredictExample");Determine the simulated classification labels.
outputs = simOut.yout;
sim_label = outputs.get("label").Values.Data;
Create a confusion matrix chart from the true labels (Y) and the labels predicted by the Simulink model (sim_label).
confusionchart(Y,logical(sim_label))
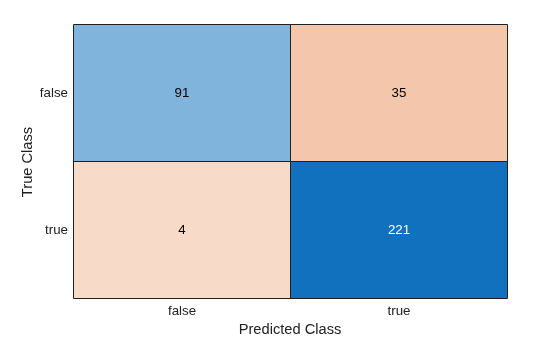
Large values on the diagonal indicate accurate predictions for the corresponding class.

