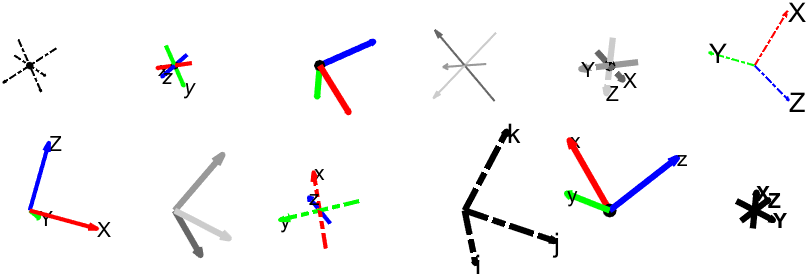
plotframe: Plot a 3-D Cartesian coordinate system
hg = plotframe( rotationMatrix, translationVector, basisVectorLengths, Name=Value )

Al momento, stai seguendo questo contributo
- Vedrai gli aggiornamenti nel tuo feed del contenuto seguito
- Potresti ricevere delle email a seconda delle tue preferenze per le comunicazioni
Cita come
George Abrahams (2023) (https://www.linkedin.com/in/georgeabrahams). plotframe: Plot a 3-D Cartesian coordinate system (https://github.com/WD40andTape/plotframe/releases/tag/1.0.0), GitHub. Retrieved December 14, 2023.
Informazioni generali
- Versione (664 KB)
-
 Visualizza la licenza su GitHub
Compatibilità della release di MATLAB
- Compatibile con R2020b e release successive
Compatibilità della piattaforma
- Windows
- macOS
- Linux
| Versione | Pubblicato | Note della release | Action |
|---|---|---|---|
| 1.0.2 | See release notes for this release on GitHub: https://github.com/WD40andTape/plotframe/releases/tag/1.0.2 |
||
| 1.0.1 | See release notes for this release on GitHub: https://github.com/WD40andTape/plotframe/releases/tag/1.0.1 |
||
| 1.0.0 |
Per visualizzare o segnalare problemi su questo componente aggiuntivo di GitHub, visita GitHub Repository.
Per visualizzare o segnalare problemi su questo componente aggiuntivo di GitHub, visita GitHub Repository.

