fft_plot function
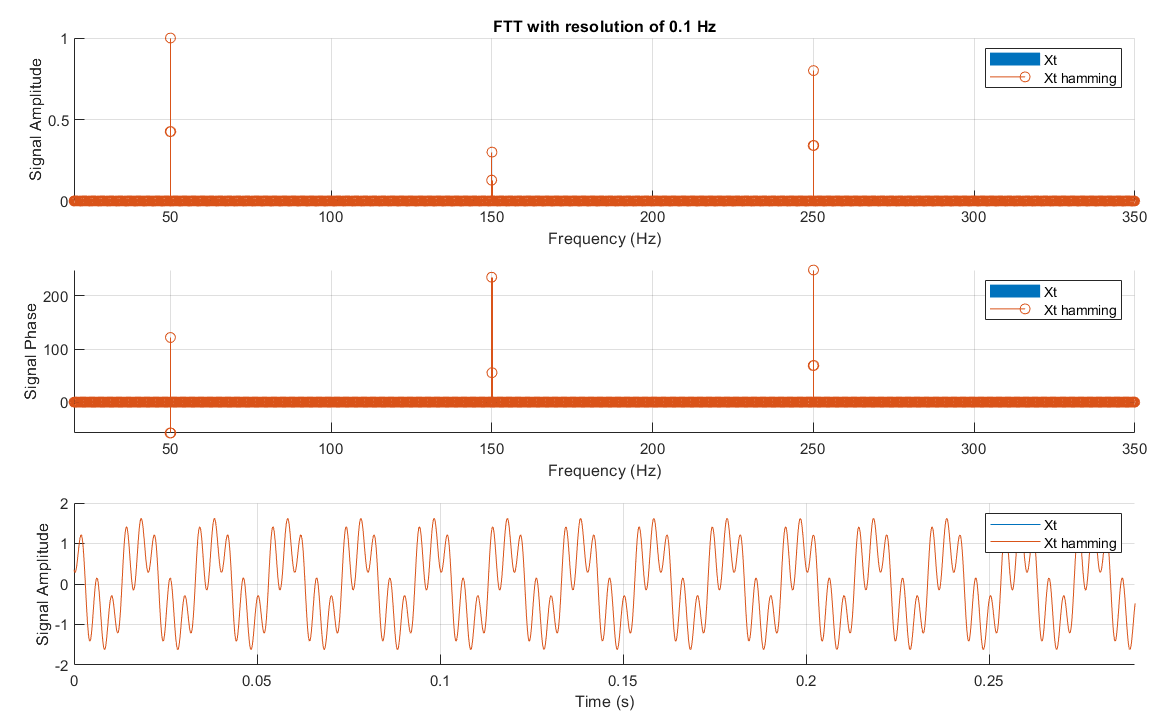
Plot signal FFT norm and phase versus frequency and signal versus time. Customizable display, also return FFT data.

Al momento, stai seguendo questo contributo
- Vedrai gli aggiornamenti nel tuo feed del contenuto seguito
- Potresti ricevere delle email a seconda delle tue preferenze per le comunicazioni
Cita come
pierre-alexandre chauvenet (2026). fft_plot function (https://it.mathworks.com/matlabcentral/fileexchange/72124-fft_plot-function), MATLAB Central File Exchange. Recuperato .
https://stackoverflow.com/questions/33962554/finding-the-phase-of-each-harmonics-using-fft
Informazioni generali
- Versione (3 KB)
Compatibilità della release di MATLAB
- Compatibile con qualsiasi release
Compatibilità della piattaforma
- Windows
- macOS
- Linux
| Versione | Pubblicato | Note della release | Action |
|---|---|---|---|
| 1.0.4 | add option to replace frequency axis with harmonic number |
||
| 1.0.3 | additional display options |
||
| 1.0.2 | - take both line or column signal input |
||
| 1.0.1 | return fft data (norm, angle, frequency)
|
||
| 1.0.0 |

