Why does it take so long to delete hggroup objects?
It's not actually the hggroup objects. Deleting those is actually quite quick. It's all of the other stuff that's happening when...
circa 11 anni fa | 1
| accettato
plotyy line width and color - with multiple lines
The call to plotyy returned 3 things: [haxes,hline1,hline2] = plotyy( ... The first (haxes) is an array of two axes hand...
circa 11 anni fa | 0
| accettato
Help using coordinates to overlay an image on a plot
The Image object (which is created by the image & imagesc commands) has a pair of properties named XData and YData. Normally, wh...
circa 11 anni fa | 0
Why does arrow fail? (R2015a)
I'm not sure what "arrow" is, but that code fragment looks like it's trying to create a vector which holds "narrows" copies of t...
circa 11 anni fa | 1
| accettato
Pubblicato
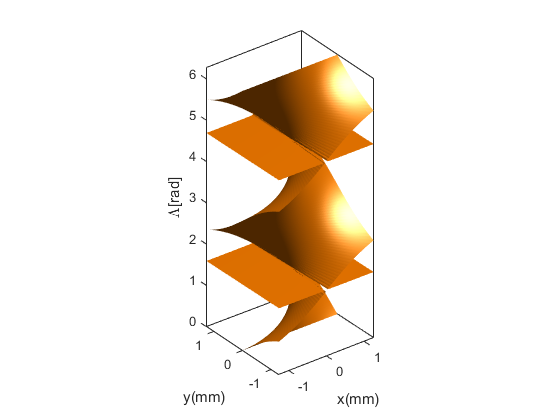
Implicit Surface Intersections
Implicit Surface IntersectionsWe talked about implicit surfaces here back in March. Recently, there was an interesting...
circa 11 anni fa
How can I create a plot during an Optimization using Output Function?
My guess is that you need a drawnow at the end to tell the graphics system that it can go ahead and push the graphics out to the...
circa 11 anni fa | 0
| accettato
X and Y co-ordinates of a surface?
Depending on the details of your surface, it can be simple, but for the general case, you're probably looking for <http://www.ma...
circa 11 anni fa | 0
I want to draw a graphic simulation of a robot using matlab. need to plot the lines in place of arm and then show the movement
The example in <http://blogs.mathworks.com/graphics/2014/10/21/double_pendulum/ this blog post> is rather Simulink centric, but ...
oltre 11 anni fa | 0
Graph one set of data in two different colors
One approach is something like the following: x = rand(1,500); y = rand(1,500); mask = x./y > 4; scatter(x(mask),y...
oltre 11 anni fa | 0
Rotate x axis labels boxplot Matlab 2015
As of R2014b, it is a lot simpler: boxplot(data,'Labels',names); set(gca,'FontSize',10,'XTickLabelRotation',90)
oltre 11 anni fa | 4
| accettato
How can I find intersection of a cylinder and helical isosurface.
In general, computing the intersection of implicit surfaces is a fairly gnarly problem. I think that the <https://www.cs.purdue....
oltre 11 anni fa | 2
| accettato
Pubblicato
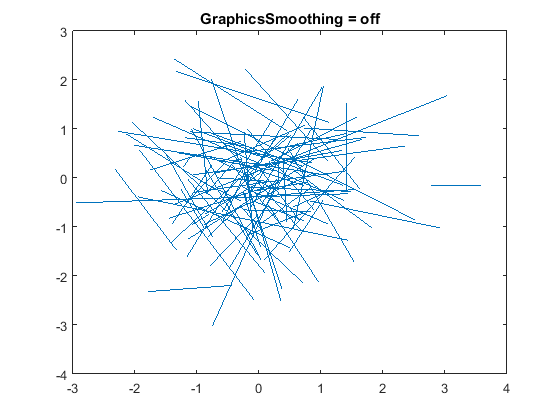
GraphicsSmoothing and AlignVertexCenters
GraphicsSmoothing and AlignVertexCentersIn R2014b we introduced a new property on the figure named GraphicsSmoothing. When...
oltre 11 anni fa
How to plot a contourf ?
The easiest way to deal with non-numeric data is to give contour numeric indices into the data and use the data as your TickLabe...
oltre 11 anni fa | 0
| accettato
How can i plot a surface defined by scattered points within the convex hull of those points.
In this particular case, it looks like you can project the surface down to 2D on either the Y=0 or X=0 planes. Then you can do t...
oltre 11 anni fa | 2
| accettato
How to draw-project routes of lines on a plane after rotating them
If the goal is just to draw the lines, then hgtransform is a good solution. You would do something like this: g = hgtransfo...
oltre 11 anni fa | 0
how to create a contour for a fittype object?
One simple way is to get the data from the surface that the plot method creates. h = plot(fitresult, [full_data(:,1), full_...
oltre 11 anni fa | 1
| accettato
Matlab real time plot)graph)
The examples for <http://www.mathworks.com/help/matlab/ref/animatedline-object.html animatedline> are a good place to start.
oltre 11 anni fa | 0
How do I create a legend that explaines scatter plot by marker size
You need a separate object for each legend entry. Something like this: rng default x = randn(1,100); y = randn(1,100)...
oltre 11 anni fa | 2
I would like axis off except xlabel, but this is not working, why?
The axis('off') command turns off the visibility of all of the decorations of the axes. You need to turn the one you want back o...
oltre 11 anni fa | 1
find line handles related to legend entries
For your purposes here, I would think that the easiest is to use the DisplayName property on the objects. That matches the strin...
oltre 11 anni fa | 1
| accettato
K-means, nice graphics
What form do you have your variations in? If your ellipses are axis aligned, then you can use the rectangle command. So if y...
oltre 11 anni fa | 1
Find Z-value corresponding to X and Y points
If the X & Y are in the input matrices, then you can do the following: [x,y,z] = peaks; h = surf(x,y,z); [r,c] = find...
oltre 11 anni fa | 1
Pubblicato
Stacked Bar3
Stacked Bar3MATLAB's bar3 command is kind of cool, but what if we have a 3D matrix like this?rng(0) array = randi(10,[4 5...
oltre 11 anni fa
using Matlab to plot density contour for scatter plot
Scatter doesn't do any binning. It's showing each individual data element. Perhaps this approach does what you want? x =...
oltre 11 anni fa | 5
| accettato
How to make circular colormap surf plot
The surface has a range of Z values, and the circle is ending up behind it. If you're using R2014b or later, you can turn of...
oltre 11 anni fa | 1
How to save a figure to png file format?
That error message is trying to say that the syntax for hgexport is this: hgexport(gcf,'image.png')
oltre 11 anni fa | 0
Is it possible to use GraphicsSmoothing for lines and not for the figure box?
No, it's implemented using <https://en.wikipedia.org/wiki/Multisample_anti-aliasing MSAA> , which means that it applies to all o...
oltre 11 anni fa | 1
| accettato
Axes don't move along with grandparent uipanel
What version of MATLAB are you using? That looks like a bug that was fixed in R2014b. If it's the one I'm thinking off, then...
oltre 11 anni fa | 0
| accettato
How to remove artifacts in plots?
I think I might know what you're referring to. I'm guessing that you're using a version of MATLAB which is older than R2014b....
oltre 11 anni fa | 0
| accettato
Can MATLAB legend color order be changed as the legend element order changes?
I got lost at this step: 4. Selected the 'String' property and re-ordered the elements of the legend I don't think that ...
oltre 11 anni fa | 0
| accettato