Pubblicato
Happy New Year
Happy New YearI hope that you had a great year and that next year is even better for you.Here's a little bit of fluff to...
oltre 11 anni fa

Pubblicato
Down the Tubes (Parametric Curves Part 2)
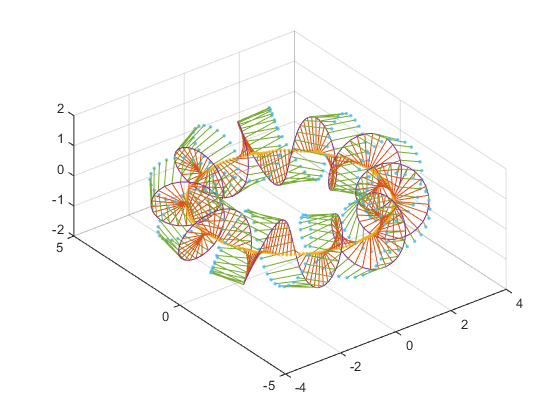
The ribbons we created last time are nice, but sometimes we want something a bit more solid. Something like a tube.... read...
oltre 11 anni fa
How do I plot the contour of a surface at a specific height?
I'm not sure I follow, do you just mean something like this? z=peaks; surf(peaks) hold on contour3(z,'LevelList',2...
oltre 11 anni fa | 3
| accettato
trisurf interpolation changed behavior in 2014b
I think I can guess from the picture. If I'm right, you've got CData which is a scalar value per vertex (as opposed to RGB color...
oltre 11 anni fa | 1
| accettato
Pubblicato
Tie a Ribbon Round It (Parametric Curves Part 1)
Tie a Ribbon Round It (Parametric Curves: Part 1)Parametric curves are easy to draw in MATLAB. For example, we can use the...
oltre 11 anni fa

colorbar's color failed with colormap longer than 1024 in scatter
That's usually caused by confusion about how large a texture map the graphics card can handle. Some opengl drivers will sometime...
oltre 11 anni fa | 1
| accettato
please help me to program of this equation of triangular patch bezier
It's sort of the 2D version of the Bézier curve case I discussed in <http://blogs.mathworks.com/graphics/2014/10/13/bezier-curve...
oltre 11 anni fa | 3
| accettato
Pubblicato
Pretriangulation
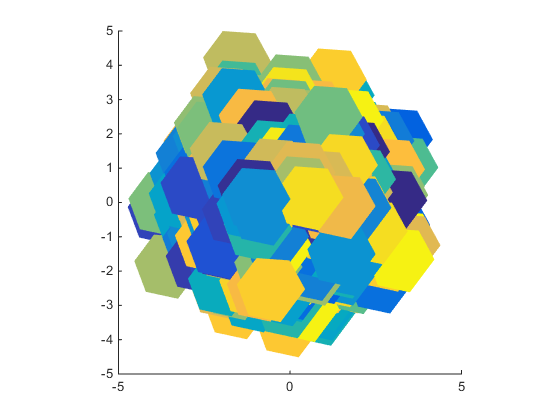
PretriangulationAn interesting question went by on MATLAB Answers the other day. I've simplified it a bit here, but it...
oltre 11 anni fa
Pubblicato
What is a Surface?
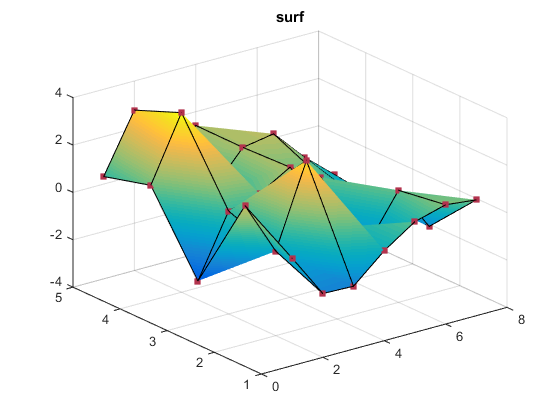
What is a Surface?What exactly is MATLAB doing when we say the following?surf(peaks)The answer seems obvious. We're telling...
oltre 11 anni fa
How to change color in a 3d plot depending from the value in each position?
You can't with plot3, but you can if you use patch. It's not obvious, but you can use patch to draw lines with interpolated colo...
oltre 11 anni fa | 1
Problem with 'Patch' graphics in 2014b - Splits in two along diagonal
The warning about DrawMode is trying to point you at the issue I described here: <http://blogs.mathworks.com/graphics/2014/11...
oltre 11 anni fa | 4
| accettato
How do you format rotated text from clabel in MATLAB 2014b?
> Is there any chance you could explain the benefit/purpose of the change to clabel? Primary reason - Bugs. The API of changi...
oltre 11 anni fa | 2
Pubblicato
Highlighting Parts of Charts
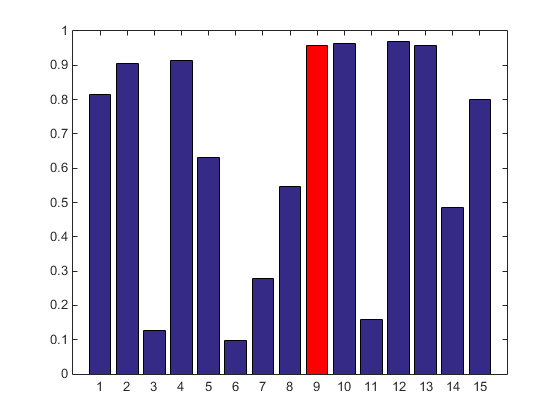
Highlighting Parts of ChartsSometimes you would like change how a chart looks in a way which isn’t supported by the...
oltre 11 anni fa
Bar width doesn't work
The widths of the bars are calculated from the spacing of the XData. You could calculate backwards from the spacing to come up w...
oltre 11 anni fa | 1
convert 2d image to 3d
I'm just guessing, but you would get that error message if your image was truecolor. In that case, a would be a MxNx3 variable w...
oltre 11 anni fa | 0
How to keep lines on a changing plot ?
Probably the simplest approach would be to save a handle to the image object and then just set its CData when you want to change...
oltre 11 anni fa | 0
How to hide the axes in front of 3D plots
FYI, R2014b added a new BoxStyle property to the axes which controls whether you see those front edges. The default value is 'ba...
oltre 11 anni fa | 0
How to do workaround MATLAB crash in set(gcf,'CurrentAxes',ax1)?
From the error message, my guess is that you've got multiple figures, and gcf isn't what you think it is. Perhaps something m...
oltre 11 anni fa | 2
Pubblicato
SortMethod
SortMethodToday we're going to talk about the SortMethod property which was added to the Axes object in R2014b. It's...
oltre 11 anni fa

question about pause function,and real time drawing
There are a couple of suggestions you might try in <http://www.mathworks.com/help/matlab/creating_plots/animation-techniques.htm...
quasi 12 anni fa | 0
Pubblicato
Making Things Move
After my post about using MATLAB Graphics from Simulink, Aditya had a great question about using this technique for 3D...
quasi 12 anni fa
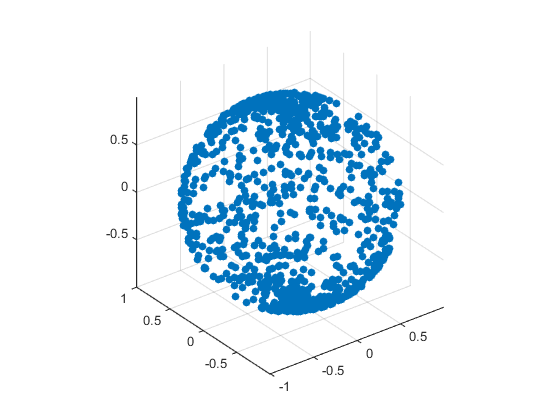
RGB values for 2014b default colors
The simplest way is the ColorOrder property on the axes. get(gca,'ColorOrder') To get the values without an axes, you ca...
quasi 12 anni fa | 8
| accettato
Trouble plotting 2D and 3D models of data.
It's trying to say that you've indexed off the end of your array of linestyles. The variable scm contains 6 linestyles. When you...
quasi 12 anni fa | 0
| accettato
MatlabR2014b no more circle market type in plot
I think that R2013b was actually one of the last releases where this worked, although I think that it did issue a warning the fi...
quasi 12 anni fa | 2
surface data representation (triangulation...?)
The new alphashape command does a pretty good job with this. Here's what I get with the defaults: shp=alphaShape(x,y,z); ...
quasi 12 anni fa | 1
graphic with MatLab R2014b
I'm guessing that h is the handle that was returned when you first called figure. Those used to be doubles, but now they're "rea...
quasi 12 anni fa | 1
Pubblicato
Using MATLAB Graphics from Simulink
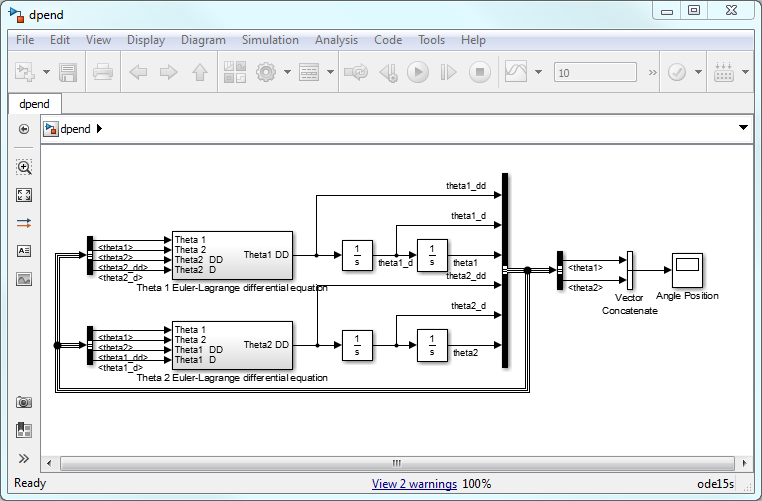
Today we're going to take a break from the math behind parametric curves and take a look at using MATLAB Graphics from...
quasi 12 anni fa
rotating contourf in r2014b
Sean's right. The rotate command only works on a few types of objects, and you probably want to try hgtransform instead. Tha...
quasi 12 anni fa | 2
| accettato
Problem with contourf plotting
I think I've seen that one before and that it's fixed in R2014b. If I remember correctly, it had something to do with the wa...
quasi 12 anni fa | 1
| accettato
Graphical method of finding roots g(x) = h(x) ?
The plot command you have is plotting 'x+1' against 'x^3'. I think that what you want is something more like this: plot(x,g...
quasi 12 anni fa | 0
| accettato