visualize
Visualize and validate filter response
Description
visualize( plots the magnitude
response of the octave-band filter octFilt)octFilt. The plot is updated
automatically when properties of the object change.
visualize(___, creates
a mask based on the class of filter specified by mType)mType, using
either of the previous syntaxes. Specify mType as 'class
0', 'class 1', or 'class 2'. The
mask attenuation limits are defined in the ANSI S1.11-2004 standard. The mask center
frequency is the ANSI standard center frequency, with band edge frequencies on
either side of the CenterFrequency set in
octFilt.
If the mask is green, the design is compliant with the ANSI S1.11-2004 standard.
If the mask is red, the design breaks compliance.
hvsz = visualize(___)dsp.DynamicFilterVisualizer object when called with any of the
previous syntaxes.
Examples
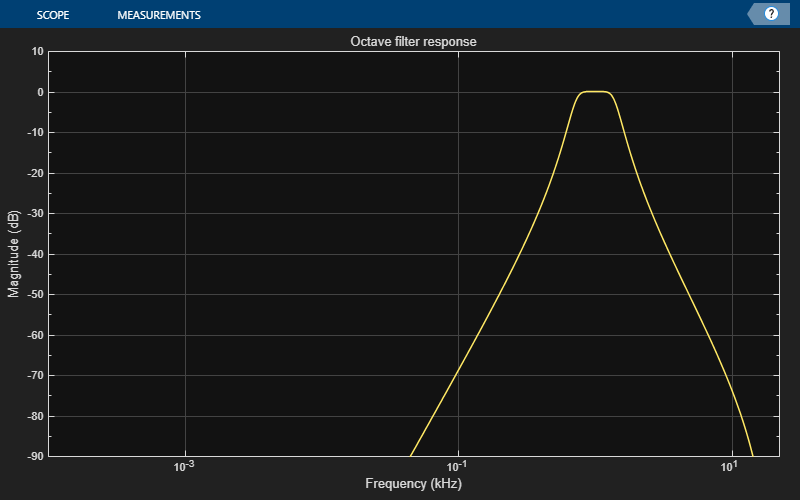
Create an octaveFilter System object™ and then plot the magnitude response of the filter.
octFilt = octaveFilter;
visualize(octFilt)
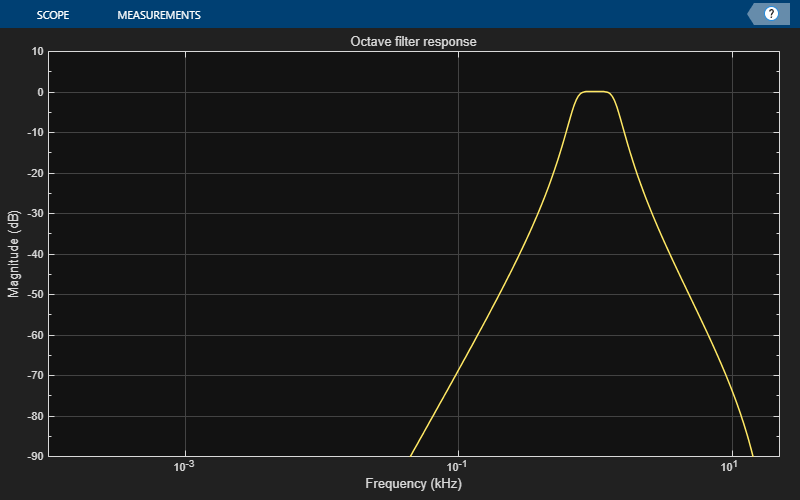
Create an octaveFilter System object™. Plot a 5096-point frequency representation.
octFilt = octaveFilter;
visualize(octFilt,5096)
Create an octaveFilter System object™. Visualize the class 1 compliance of the filter design.
octFilt = octaveFilter;
visualize(octFilt,'class 1')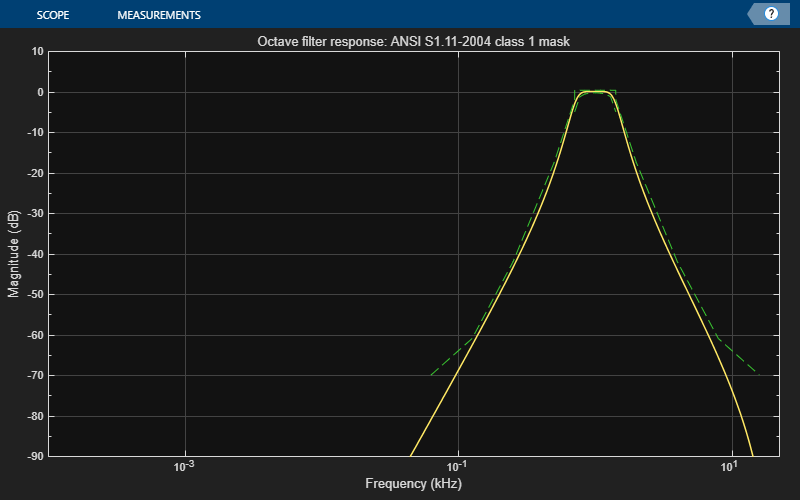
Input Arguments
Version History
Introduced in R2016b