bandEdges = getBandedgeFrequencies(obj)
returns the bandedge frequencies of the filters designed by obj. If
there are M filters, then there are M center
frequencies and M+1 band edge frequencies.
[bandEdges,centerFrequencies] = getBandedgeFrequencies(obj)
returns the center frequencies of the filters designed by obj.
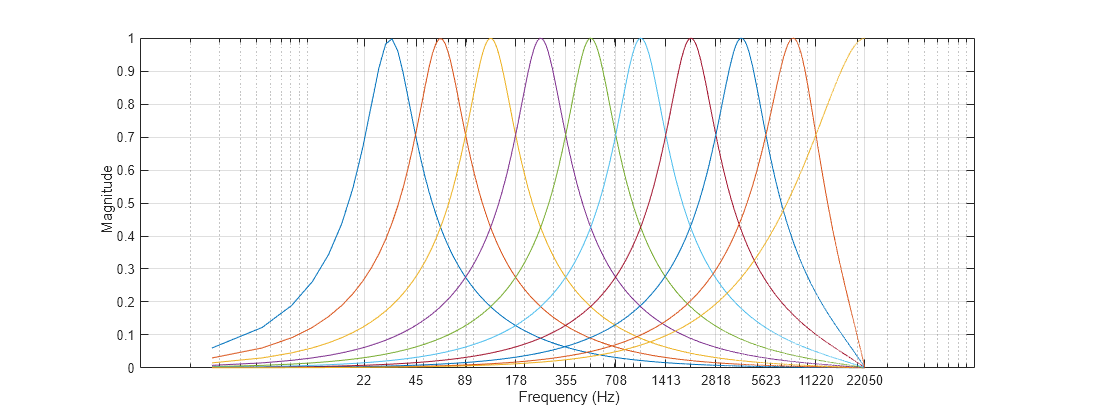
Call freqz to get the frequency response of the filter bank. Plot the magnitude frequency response. Use the bandedge frequencies to label the frequency axis.
[H,f] = freqz(octFiltBank);
semilogx(f,abs(H))
xticks(round(bE))
xlabel('Frequency (Hz)')
ylabel('Magnitude')
grid on
h = gcf;
set(h,'Position',[h.Position(1) h.Position(2) h.Position(3)*2 h.Position(4)])
You can also select a web site from the following list:
How to Get Best Site Performance
Select the China site (in Chinese or English) for best site performance. Other MathWorks country sites are not optimized for visits from your location.