Visualize Network Traffic and Log Events
This example shows how to simulate, visualize, and analyze network traffic and events in a Bluetooth® low energy (LE) and WLAN coexistence scenario.
Using this example, you can:
Create a Bluetooth LE-WLAN coexistence scenario consisting of a Central node, a Peripheral node, an access point (AP), and a station (STA).
Add On-Off application traffic between the nodes.
Simulate the scenario, and visualize the state transitions and channel occupancy of the nodes.
Log, read, and filter events from the nodes.
Analyze and correlate network traffic visualization and events log data.
Set the random number generator to 1 to ensure the repeatability of results. The seed value controls the pattern of random number generation. Initializing the random number generator using the same seed ensures the same result. To improve the accuracy of your simulation results, after running the simulation, you can change the seed value, run the simulation again, and average the results over multiple simulations.
rng(1,"combRecursive")Initialize the wireless network simulator.
networkSimulator = wirelessNetworkSimulator.init;
Create Bluetooth LE Nodes and Add Traffic
Create a Bluetooth LE Central node and a Peripheral node, specifying their names and positions (in meters).
centralNode = bluetoothLENode("central",Name="Central", ...
    Position=[0 0 0]);          % In x-, y-, and z-coordinates
peripheralNode = bluetoothLENode("peripheral",Name="Peripheral", ...
    Position=[1 0 0]);          % In x-, y-, and z-coordinates
Create a default Bluetooth LE link layer (LL) connection configuration object. Configure the LL connection between the Central and Peripheral nodes.
cfgConnection = bluetoothLEConnectionConfig;
configureConnection(cfgConnection,centralNode,peripheralNode);
Create and configure On-Off application traffic, specifying the data rate (in Kbps), packet size (bytes), On state and Off state duration (in seconds). Add application traffic at the Central node to Peripheral node.
LETraffic = networkTrafficOnOff(DataRate=200,PacketSize=27,OnTime=inf);
addTrafficSource(centralNode,LETraffic,DestinationNode=peripheralNode)
Create WLAN Nodes and Add Traffic
Configure a WLAN node as an AP by specifying the operating mode and type of interference modeling. Create a WLAN AP from the specified configuration, specifying the name, position (in meters), MAC frame abstraction, and PHY abstraction method.
accessPointCfg  = wlanDeviceConfig(Mode="AP",BandAndChannel=[2.4 6],InterferenceModeling="overlapping-adjacent-channel");
accessPointNode = wlanNode(Name="AP",Position=[0 10 0],DeviceConfig=accessPointCfg,MACModel="full-mac",PHYModel="full-phy");
Configure a WLAN node as an STA by specifying the operating mode and type of interference modeling. Create a WLAN STA from the specified configuration, specifying the name, position (in meters), MAC frame abstraction method, and PHY abstraction method.
stationCfg  = wlanDeviceConfig(Mode="STA",BandAndChannel=[2.4 6],InterferenceModeling="overlapping-adjacent-channel");
stationNode = wlanNode(Name="STA",Position=[5 0 0],DeviceConfig=stationCfg,MACModel="full-mac",PHYModel="full-phy");
Associate the STA node with the AP node.
associateStations(accessPointNode,stationNode)
Create and configure On-Off application traffic, specifying the data rate (in Kbps), and packet size (in bytes). Add the application traffic at the AP node to the STA node.
wlanTraffic = networkTrafficOnOff(DataRate=10e6,PacketSize=1500,OnTime=inf);
addTrafficSource(accessPointNode,wlanTraffic,DestinationNode=stationNode)
Add Nodes to Simulator
Add all the nodes to the wireless network simulator.
addNodes(networkSimulator,[centralNode peripheralNode])
addNodes(networkSimulator,[accessPointNode stationNode])
Configure Traffic Viewer and Event Tracer
Create a default wirelessTrafficViewer object. Add all the nodes to the wireless traffic viewer.
trafficViewer = wirelessTrafficViewer;
addNodes(trafficViewer,networkSimulator.Nodes)
Create a wirelessNetworkEventTracer object, specifying the name of the MAT file in which you want to log events.
if exist("EventLog.mat","file")
    delete("EventLog.mat")
end
eventTracer = wirelessNetworkEventTracer(FileName="EventLog.mat");
Add all the nodes to the wireless network event tracer.
addNodes(eventTracer,[centralNode peripheralNode])
addNodes(eventTracer,[accessPointNode stationNode])
Simulate and Visualize Network Traffic
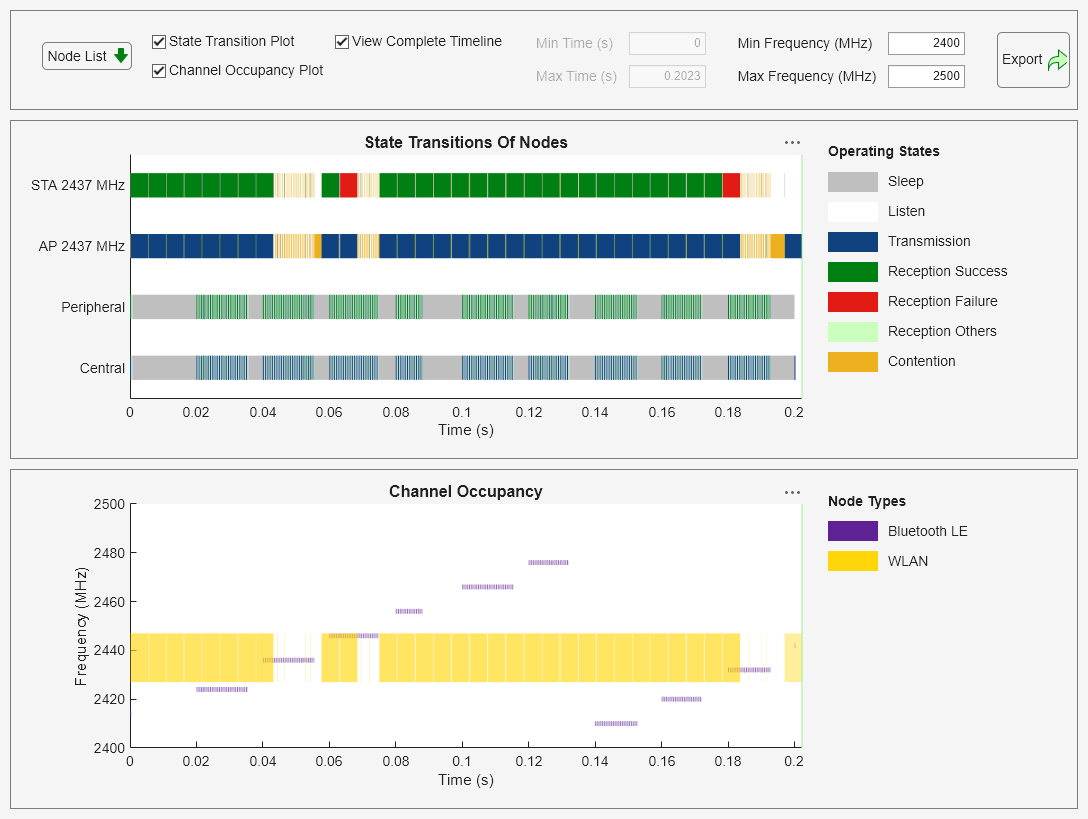
Specify the simulation time (in seconds) and run the simulation. The wireless traffic viewer shows you a visual summary of how each node moves between the transmit, listen, receive, and sleep states. The channel occupancy plot shows you exactly which frequencies Bluetooth and WLAN occupy in the 2.4 GHz band at each moment.
As the simulation runs, observe the Bluetooth LE and WLAN packets moving across the wireless medium. The Central node periodically transmits short LE packets to the Peripheral node. At the same time, the AP transmits WLAN frames toward the STA. The WLAN transmissions appear as longer, continuous blocks of airtime because it aggregates multiple MAC frames and transmits them simultaneously. The WLAN transmissions are also more frequent and faster because the PHY operates at a much higher data rate than Bluetooth LE, enabling WLAN to transmit large amounts of data in relatively short periods.
In the channel occupancy visualization, you can observe that WLAN occupies a wide yellow band around its operating channel, while Bluetooth appears as brief purple markers that jump across the band. Each purple tick corresponds to a Bluetooth LE transmission and reception on a specific data channel frequency. You can correlate a Bluetooth LE transmission or reception to an event by matching the timestamp of a TransmissionStarted or ReceptionEnded entry in the MAT file with the corresponding purple marker in the channel occupancy plot. If the transmission or reception frequency sits inside a region where WLAN is transmitting, and if the Peripheral node reports a reception failure, you can attribute that failure to the coexistence interference. To visualize and understand coexistence, compare the AP node TransmissionStarted timestamps with the Peripheral node ReceptionEnded timestamps and look for overlaps in both time and frequency.
simulationTime = 0.2;
run(networkSimulator,simulationTime)
Log and Analyze Events
Read and filter all the events from the EventLog.mat MAT file.
allEvents = read(eventTracer);
Read events from the Central and Peripheral nodes related to the TransmissionStarted and ReceptionEnded events, respectively.
The centralTx output shows you a table containing all transmission events that occurred at the Central node. The peripheralRx output shows a table with all receptions at the Peripheral node. Each row represents one packet transmission and reception.
The timestamps in the peripheralRx table occur slightly after the corresponding transmission timestamps in the centralTx table because of the transmission time of the packet and the delay caused by added impairments. By comparing the timestamps between centralTx and peripheralRx, you can calculate the end-to-end delay for each packet. The delay includes the transmission time of the packet itself plus the propagation delay through the wireless channel.
In the traffic viewer, at 0.02 seconds, you can see a indicator of a packet moving from the Central node to Peripheral node. At the same time, if you observe the centralTx event log, you find an entry with a timestamp of 0.0200 seconds. This entry confirms that the Central node started transmitting at exactly that moment. In the peripheralRx event log, observe a corresponding log entry with a timestamp 0.0203 seconds. This confirms that the Peripheral node successfully received the packet 0.528 milliseconds after the transmission started.
centralTx = read(eventTracer,EventName="TransmissionStarted",NodeName="Central")
centralTx=1×179 struct array with fields:
    EventName
    NodeName
    NodeID
    Timestamp
    TechnologyType
    EventData
peripheralRx = read(eventTracer,EventName="ReceptionEnded",NodeName="Peripheral")
peripheralRx=1×178 struct array with fields:
    EventName
    NodeName
    NodeID
    Timestamp
    TechnologyType
    EventData
Read events from the AP and STA nodes related to the TransmissionStarted and ReceptionEnded events, respectively.
Each TransmissionStarted event from the AP marks the instant when the AP wins contention and begins sending one or more aggregated MAC frames. In the traffic viewer, these events render as the long blue transmission segments on the AP row and the wide yellow blocks in the channel occupancy plot at the WLAN operating frequency. The corresponding ReceptionEnded events at the STA confirm successful delivery of those frames, and these timestamps align with green reception success marks on the STA row. When you compare these event timestamps with the traffic viewer visualization, you see groups of AP transmissions followed by STA receptions representing the higher data rate and frame aggregation in WLAN. This correlation enables you to see and understand exactly when WLAN accesses the medium, how long it holds the channel, and how those transmissions interact with nearby Bluetooth LE activity.
You can also observe WLAN contention when Bluetooth LE transmits. If a Bluetooth LE transmission occupies the channel while the AP attempts to transmit, the AP defers due to a clear channel assessment (CCA) indication. In the traffic viewer, this appears as a period of alternating Listen and Contention states for the AP, and in the event log you can see no TransmissionStarted event for that period. This confirms that WLAN deferred because the wireless medium was busy.
accessPointTx = read(eventTracer,EventName="TransmissionStarted",NodeName="AP")
accessPointTx=1×66 struct array with fields:
    EventName
    NodeName
    NodeID
    Timestamp
    TechnologyType
    EventData
stationRx = read(eventTracer,EventName="ReceptionEnded",NodeName="STA")
stationRx=1×65 struct array with fields:
    EventName
    NodeName
    NodeID
    Timestamp
    TechnologyType
    EventData
Display the event data for the TransmissionStarted and ReceptionEnded events at the Central and Peripheral nodes, respectively.
if ~isempty(centralTx)
    disp("EventData for first Central TransmissionStarted event:")
    centralTx(1).EventData
end
EventData for first Central TransmissionStarted event:
ans = struct with fields:
                        PDU: []
                     Length: 32
                   Duration: 2.9600e-04
              TransmitPower: 20
    TransmitCenterFrequency: 2.4140e+09
          TransmitBandwidth: 2000000
            CenterFrequency: 2.4410e+09
                  Bandwidth: 80000000
           LogicalTransport: "ACL"
                       Role: "central"
                    PHYMode: "LE1M"
              AccessAddress: "5DA44270"
if ~isempty(peripheralRx)
    disp("EventData for first Peripheral ReceptionEnded event:")
    peripheralRx(1).EventData
end
EventData for first Peripheral ReceptionEnded event:
ans = struct with fields:
                       PDU: []
                    Length: 32
                  Duration: 2.9700e-04
    ReceiveCenterFrequency: 2.4140e+09
          ReceiveBandwidth: 2000000
           CenterFrequency: 2.4410e+09
                 Bandwidth: 80000000
           PHYDecodeStatus: 0
           PDUDecodeStatus: 0
                      SINR: 56.5184
                      RSSI: -20.0756
         TransmitterNodeID: 1
          LogicalTransport: "ACL"
                      Role: "peripheral"
                   PHYMode: "LE1M"
             AccessAddress: "5DA44270"
Display the event data for the TransmissionStarted and ReceptionEnded events at the AP and STA nodes, respectively.
if ~isempty(accessPointTx)
    disp("EventData for first AP TransmissionStarted event:")
    accessPointTx(1).EventData
end
EventData for first AP TransmissionStarted event:
ans = struct with fields:
                        PDU: []
                     Length: 20
                   Duration: 5.2000e-05
              TransmitPower: 10
    TransmitCenterFrequency: 2.4370e+09
          TransmitBandwidth: 20000000
            CenterFrequency: 2.4370e+09
                  Bandwidth: 20000000
if ~isempty(stationRx)
    disp("EventData for first STA ReceptionEnded event:")
    stationRx(1).EventData
end
EventData for first STA ReceptionEnded event:
ans = struct with fields:
                       PDU: []
                    Length: 20
                  Duration: 5.2000e-05
    ReceiveCenterFrequency: 2.4370e+09
          ReceiveBandwidth: 20000000
           CenterFrequency: 2.4370e+09
                 Bandwidth: 20000000
           PHYDecodeStatus: 0
           PDUDecodeStatus: 0
       IsIntendedReception: 0
References
[1] Bluetooth® Technology Website. “Bluetooth Technology Website | The Official Website of Bluetooth Technology.” Accessed December 22, 2025. https://www.bluetooth.com/.
[2] Bluetooth Special Interest Group (SIG). "Bluetooth Core Specification." v6.1. https://www.bluetooth.com/specifications/specs/core-specification-6-1/.
See Also
Objects
bluetoothLENode|bluetoothLEConnectionConfig|wlanNode(WLAN Toolbox) |wlanDeviceConfig(WLAN Toolbox) |wirelessNetworkSimulator(Wireless Network Toolbox) |wirelessNetworkEventTracer(Wireless Network Toolbox) |wirelessTrafficViewer(Wireless Network Toolbox) |networkTrafficOnOff(Wireless Network Toolbox)
Topics
- Wireless Network Simulator (Wireless Network Toolbox)
- Event Tracing in Network Simulations (Wireless Network Toolbox)
- Generate Periodic, Bursty, and Random Traffic in Wireless Network (Wireless Network Toolbox)
- Overview of Traffic Models (Wireless Network Toolbox)