Run Static Analysis in Polyspace User Interface
This topic shows how to run static analysis in the user interface of the Polyspace® desktop products.
If using the Polyspace Server products, see Set Up Code Prover Analysis on Servers During Continuous Integration.
If using Polyspace as You Code, see Set Up Polyspace Analysis in IDEs.
This topic describes how to run an analysis in the Polyspace user interface, monitor progress, fix compilation issues, and open analysis results as available.
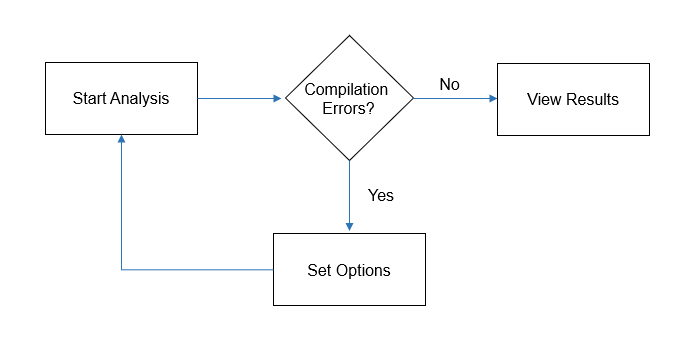
After you specify your source files and compiler, start the Polyspace analysis. During analysis, Polyspace first compiles your code, and then checks for bugs (Bug Finder) or proves code correctness (Code Prover). If you encounter compilation errors, read the error message and diagnose the root cause of the error. To resolve the errors, you often have to set some Polyspace configuration options and rerun the analysis.

Arrange Layout of Windows for Project Setup
To set up a convenient distribution of windows, in the Polyspace user interface, select Window > Reset Layout > Project Setup.

Set Product and Result Location
To switch products or create a separate folder for each run, select options from the drop-down list beside the Run button. For instance, to avoid overwriting previous results each time that you run Bug Finder and keep existing results, select Create new Bug Finder result folder.

The results are stored in subfolders Module_1,
Module_2, and so on in the project folder. To find the
physical location of the project folder, right-click a project on the
Project Browser pane and select Open Folder with
File Manager.
To use a different folder naming convention or a different storage location for results, select Tools > Preferences and use the options on the Project and Results Folder tab. See also Create Naming Convention for Results Folder.
Start and Monitor Analysis
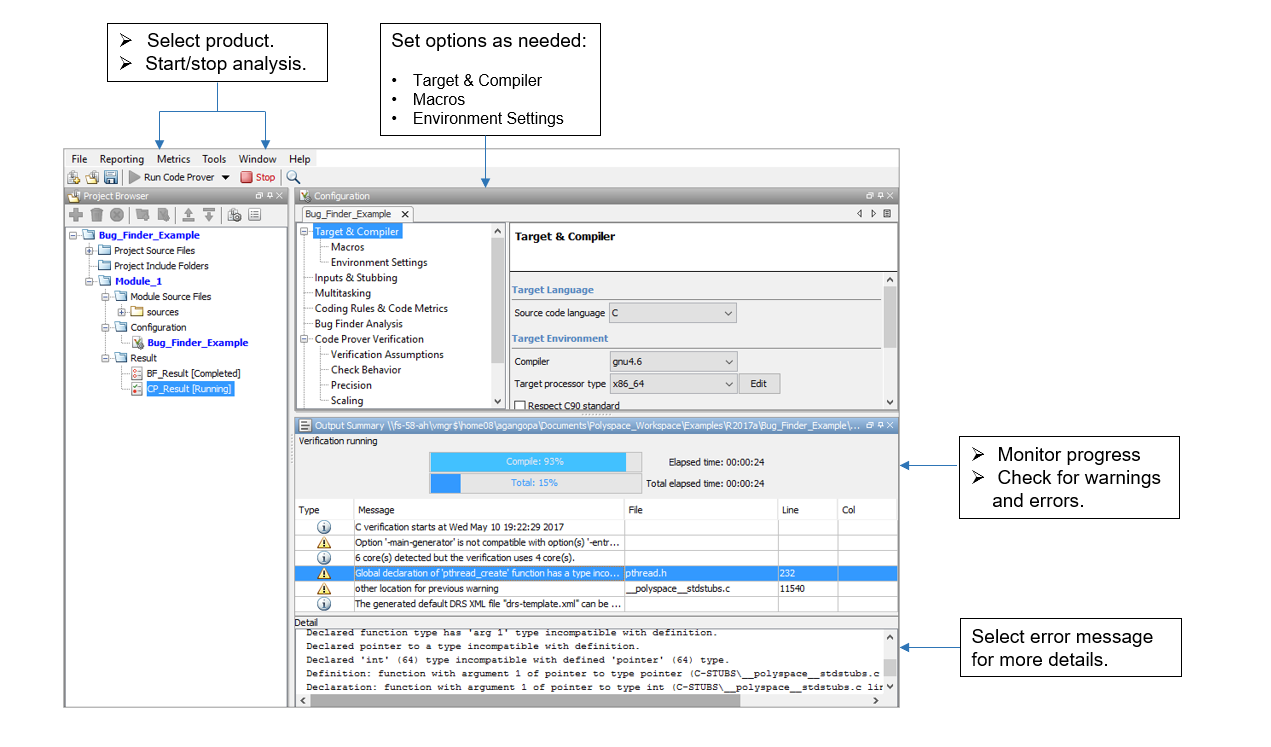
If your project has multiple modules, select the module that you want to analyze. To start the analysis, select Run Bug Finder or Run Code Prover. Monitor progress on the Output Summary pane.
Bug Finder: You can see some results after partial analysis because certain defect checkers do not need cross-functional information and can show results as soon as a function is analyzed. If results are available while the analysis is still running, you see this icon beside the Run Bug Finder button:

The icon indicates the number of results available. To open the results, click the icon. Once the analysis is over, the Running label in the icon changes to Completed. To reload the full set of results, click the icon again.
Code Prover: You can see results only after the analysis is complete. Code Prover is more likely to report compilation errors because it does a more rigorous analysis and must follow stricter rules for compilation. The progress bar distinguishes between the various phases of analysis starting from compilation.
Fix Compilation Errors
If compilation errors occur, the analysis continues on the remaining files that do
compile. The Dashboard pane shows that some files did not
compile and links to the Output Summary pane for details. The
Output Summary pane shows compilation errors with a ![]() icon.
icon.
For further diagnosis, select the error message for more details. Identify the line in your code responsible for the compilation error. You can use the error message details to understand why the line compiled with your compiler and what additional information Polyspace requires to emulate your compiler. See if you can work around the error by using a Polyspace option. For more information, see Troubleshoot Compilation Errors.
For more precise run-time error checking in Code Prover, it is recommended that
you fix all compilation errors. Use the option Stop analysis if a
file does not compile (-stop-if-compile-error).
Open Results
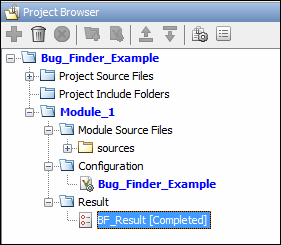
After analysis, the results open automatically. To open results that you have closed, double-click the result node on the Project Browser pane.

The Bug Finder (Code Prover) results are stored in a .psbf
(.pscp) file in the results folder. For instance, if you save
your project in C:\Projects\, a .psbf file for
the Bug Finder analysis results on the first module Module_1 is
stored in C:\Projects\Module_1\BF_Result. See also Contents of Polyspace Project and Results Folders.