plot
Display RF propagation data in Site Viewer
Description
plot( displays data from the
specified propagation data object in the current Site Viewer. The function
displays each data point as a circular marker that is colored according to the
corresponding value.pd)
plot(___,
specifies options using name-value arguments.Name=Value)
Examples
Launch Site Viewer with basemaps and building files for Manhattan. For more information about the OpenStreetMap® file, see [1].
viewer = siteviewer("Basemap","streets_dark",...
        "Buildings","manhattan.osm");
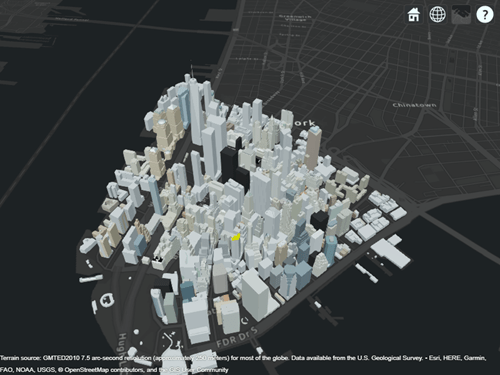
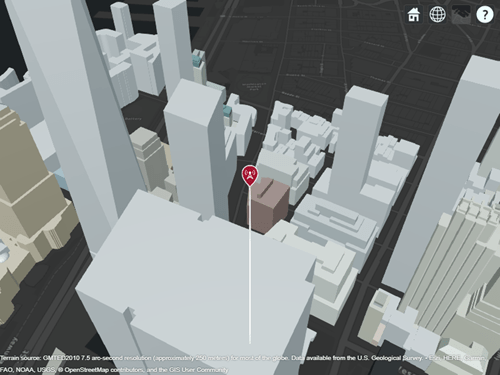
Show a transmitter site on a building.
tx = txsite("Latitude",40.7107,...
        "Longitude",-74.0114,...
        "AntennaHeight",80);
show(tx)
Create receiver sites along nearby streets.
latitude = [linspace(40.7088, 40.71416, 50), ...
        linspace(40.71416, 40.715505, 25), ...
        linspace(40.715505, 40.7133, 25), ...
        linspace(40.7133, 40.7143, 25)]';
longitude = [linspace(-74.0108, -74.00627, 50), ...
        linspace(-74.00627 ,-74.0092, 25), ...
        linspace(-74.0092, -74.0110, 25), ...
        linspace(-74.0110, -74.0132, 25)]';
rxs = rxsite("Latitude", latitude, "Longitude", longitude);
Compute signal strength at each receiver location.
signalStrength = sigstrength(rxs, tx)';
Create a propagationData object to hold computed signal strength data.
tbl = table(latitude, longitude, signalStrength);
pd = propagationData(tbl);
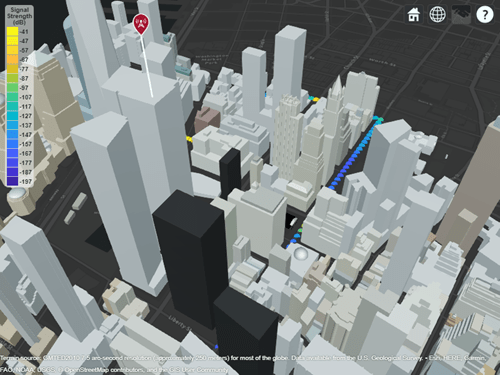
Plot the signal strength data on a map as colored points.
legendTitle = "Signal" + newline + "Strength" + newline + "(dB)";
plot(pd, "LegendTitle", legendTitle, "Colormap", parula);
Appendix
[1] The OpenStreetMap file is downloaded from https://www.openstreetmap.org, which provides access to crowd-sourced map data all over the world. The data is licensed under the Open Data Commons Open Database License (ODbL), https://opendatacommons.org/licenses/odbl/.
Input Arguments
Name-Value Arguments
Specify optional pairs of arguments as
Name1=Value1,...,NameN=ValueN, where Name is
the argument name and Value is the corresponding value.
Name-value arguments must appear after other arguments, but the order of the
pairs does not matter.
Example: plot(pd,Type="power") specifies the type as
"power".
Before R2021a, use commas to separate each name and value, and enclose
Name in quotes.
Example: plot(pd,"Type","power") specifies the type as
"power".
Type of value to plot, specified as "custom",
"power", "efield",
"sinr", or "pathloss". This
table shows the default color limits and legend title for each
type.
| Type | Color limits | Legend title |
|---|---|---|
"custom" | [min(Data) max(Data)] | '' |
"power" | [-120 -5] | Power (dBm) |
"efield" | [20 135] | E-field (dBuV/m) |
"sinr" | [-5 20] | SINR (dB) |
"pathloss" | [45 160] | Path loss (dB) |
Data Types: char | string
Data value levels to plot, specified as a numeric vector. The function
uses this argument to bin the propagation data. When plotting, the
function selects the colors the bins by using the
Colors argument, if specified, or else the
Colormap and ColorLimits
arguments. The function does not display data points with values below
the minimum level.
Data Types: double
Colors of the data points, specified as an M-by-3
array of RGB triplets, an array of string scalars, or a cell array of
character vectors. The function assigns the colors to the corresponding
values specified by the Levels argument.
The Colors argument cannot be combined with the
Colormap or ColorLimits
arguments.
Data Types: double | char | string
Colormap for coloring the points, specified as a colormap name or as an M-by-3 array of RGB triplets that define M individual colors.
This table lists the colormap names.
| Colormap Name | Color Scale |
|---|---|
|
|
|
|
|
|
|
|
|
|
|
|
|
|
|
|
|
|
|
|
|
|
|
|
|
|
|
|
|
|
|
|
|
|
|
|
|
|
|
|
|
|
|
|
The Colormap argument cannot be used with the
Colors argument.
Data Types: double | char | string
Color limits for the colormap, specified as a two-element vector of
the form [min max]. The color limits indicate the
data level values that map to the first and last colors in the colormap.
The ColorLimits argument cannot be used with the
Colors argument.
Data Types: double
Size of the data markers plotted on the map, specified as a positive numeric scalar in pixels.
Data Types: double
Show the color legend on the map, specified as true
or false.
Data Types: logical
Title of the color legend, specified as a character vector or a string scalar.
Data Types: string | char
Map for the surface data, specified as a siteviewer
object.1
The default value is the current Site Viewer or a new Site Viewer, if none
is open.
Data Types: char | string
Version History
Introduced in R2020a
1 Alignment of boundaries and region labels are a presentation of the feature provided by the data vendors and do not imply endorsement by MathWorks®.