plot
Plot collision configuration
Description
plot(
plots the collision-checking
configuration of an ccConfig
)InflationCollisionChecker
object. Use
plot
to visually verify that the circles in the configuration fully
enclose the vehicle.
plot(
specifies options using one or more ccConfig
,Name,Value
)Name,Value
pair arguments. For
example, plot(ccConfig,'Ruler','Off')
turns off the ruler that indicates
the locations of the circle centers.
Examples
Create Collision-Checking Configuration with Center Placements
Create a collision-checking configuration for a costmap. Manually specify the circle centers so that they fully enclose the vehicle.
Define the dimensions of a vehicle by using a vehicleDimensions
object.
length = 5; % meters width = 2; % meters vehicleDims = vehicleDimensions(length,width);
Define three circle centers and the inflation radius to use for collision checking. Place one center at the vehicle's midpoint. Offset the other two centers by an equal amount on either end of the vehicle.
distFromSide = 0.175; centerPlacements = [distFromSide 0.5 1-distFromSide]; inflationRadius = 1.2;
Create and display the collision-checking configuration.
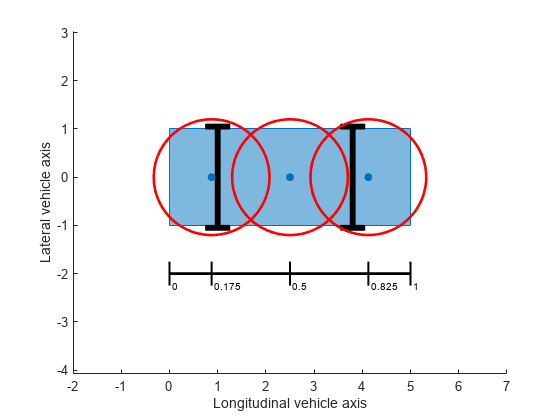
ccConfig = inflationCollisionChecker(vehicleDims, ... 'CenterPlacements',centerPlacements,'InflationRadius',inflationRadius); figure plot(ccConfig)
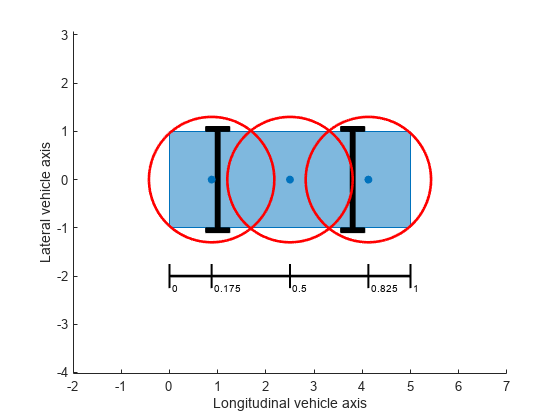
In this configuration, the corners of the vehicle are not enclosed within the circles. To fully enclose the vehicle, increase the inflation radius. Display the updated configuration.
ccConfig.InflationRadius = 1.3; plot(ccConfig)
Use this collision-checking configuration to create a 10-by-20 meter costmap.
costmap = vehicleCostmap(10,20,0.1,'CollisionChecker',ccConfig);
Input Arguments
ccConfig
— Collision-checking configuration
InflationCollisionChecker
object
Collision-checking configuration, specified as an
InflationCollisionChecker
object. To create a collision-checking
configuration, use the inflationCollisionChecker
function.
Name-Value Arguments
Specify optional pairs of arguments as
Name1=Value1,...,NameN=ValueN
, where Name
is
the argument name and Value
is the corresponding value.
Name-value arguments must appear after other arguments, but the order of the
pairs does not matter.
Before R2021a, use commas to separate each name and value, and enclose
Name
in quotes.
Example: plot(ccConfig,'Parent',ax)
plots the collision configuration
in axes ax
.
Parent
— Axes on which to plot collision configuration
Axes
object
Axes on which to plot the collision configuration, specified as the
comma-separated pair consisting of 'Parent'
and an
Axes
object. To create an Axes
object, use the
axes
function.
To plot the collision configuration in a new figure, leave
'Parent'
unspecified.
Ruler
— Display ruler
'on'
(default) | 'off'
Display the ruler that shows the locations of the circle centers, specified as the
comma-separated pair consisting of 'Ruler'
and
'on'
or 'off'
.
Version History
Introduced in R2018b
See Also
Comando MATLAB
Hai fatto clic su un collegamento che corrisponde a questo comando MATLAB:
Esegui il comando inserendolo nella finestra di comando MATLAB. I browser web non supportano i comandi MATLAB.
Select a Web Site
Choose a web site to get translated content where available and see local events and offers. Based on your location, we recommend that you select: .
You can also select a web site from the following list:
How to Get Best Site Performance
Select the China site (in Chinese or English) for best site performance. Other MathWorks country sites are not optimized for visits from your location.
Americas
- América Latina (Español)
- Canada (English)
- United States (English)
Europe
- Belgium (English)
- Denmark (English)
- Deutschland (Deutsch)
- España (Español)
- Finland (English)
- France (Français)
- Ireland (English)
- Italia (Italiano)
- Luxembourg (English)
- Netherlands (English)
- Norway (English)
- Österreich (Deutsch)
- Portugal (English)
- Sweden (English)
- Switzerland
- United Kingdom (English)