getCosts
Get cost value of cells in vehicle costmap
Description
Examples
Get Cost Matrix and Set Cost Values
Create a 5-by-10 meter vehicle costmap. Cells have side length 1, in the world units of meters. Set the inflation radius to 1. Plot the costmap, and get the default cost matrix.
costmap = vehicleCostmap(5,10);
costmap.CollisionChecker.InflationRadius = 1;
plot(costmap)
title('Default Costmap')
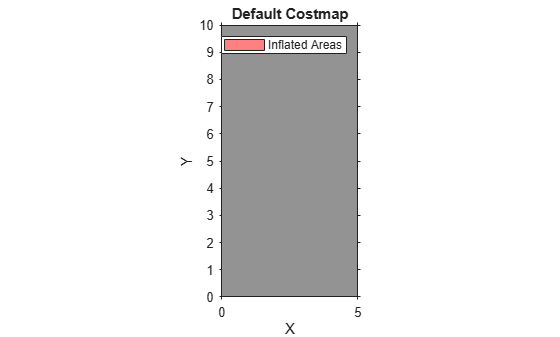
getCosts(costmap)
ans = 10×5
0.4250 0.4250 0.4250 0.4250 0.4250
0.4250 0.4250 0.4250 0.4250 0.4250
0.4250 0.4250 0.4250 0.4250 0.4250
0.4250 0.4250 0.4250 0.4250 0.4250
0.4250 0.4250 0.4250 0.4250 0.4250
0.4250 0.4250 0.4250 0.4250 0.4250
0.4250 0.4250 0.4250 0.4250 0.4250
0.4250 0.4250 0.4250 0.4250 0.4250
0.4250 0.4250 0.4250 0.4250 0.4250
0.4250 0.4250 0.4250 0.4250 0.4250
Mark an obstacle at the (x,y) coordinate (3,4) by increasing the cost of that cell.
setCosts(costmap,[3,4],0.8);
plot(costmap)
title('Costmap with Obstacle at (3,4)')
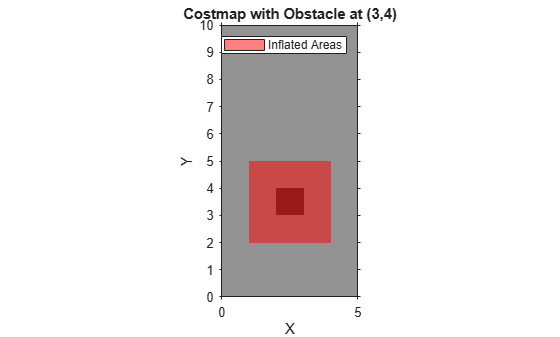
Get the cost of three cells: the cell with the obstacle, a cell adjacent to the obstacle, and a cell outside the inflation radius of the obstacle.
costVal = getCosts(costmap,[3 4;2 4;4 7])
costVal = 3×1
0.8000
0.4250
0.4250
Although the plot of the costmap displays the cell with the obstacle and its adjacent cells in shades of red, only the cell with the obstacle has a higher cost value of 0.8. The other cells still have the default cost value of 0.425.
Input Arguments
costmap
— Costmap
vehicleCostmap
object
Costmap, specified as a vehicleCostmap
object.
xyPoints
— Points
M-by-2 real-valued matrix
Points, specified as an M-by-2 real-valued matrix that represents the (x, y) coordinates of M points.
Example: [3.4 2.6]
specifies a single point at (3.4, 2.6)
Example: [3 2;3 3;4 7]
specifies three points: (3, 2), (3, 3), and (4,
7)
Output Arguments
costVals
— Cost of points
M-element real-valued vector
Cost of points in xyPoints
, returned as an
M-element real-valued vector.
Extended Capabilities
C/C++ Code Generation
Generate C and C++ code using MATLAB® Coder™.
Version History
Introduced in R2018a
See Also
Apri esempio
Si dispone di una versione modificata di questo esempio. Desideri aprire questo esempio con le tue modifiche?
Comando MATLAB
Hai fatto clic su un collegamento che corrisponde a questo comando MATLAB:
Esegui il comando inserendolo nella finestra di comando MATLAB. I browser web non supportano i comandi MATLAB.
Select a Web Site
Choose a web site to get translated content where available and see local events and offers. Based on your location, we recommend that you select: .
You can also select a web site from the following list:
How to Get Best Site Performance
Select the China site (in Chinese or English) for best site performance. Other MathWorks country sites are not optimized for visits from your location.
Americas
- América Latina (Español)
- Canada (English)
- United States (English)
Europe
- Belgium (English)
- Denmark (English)
- Deutschland (Deutsch)
- España (Español)
- Finland (English)
- France (Français)
- Ireland (English)
- Italia (Italiano)
- Luxembourg (English)
- Netherlands (English)
- Norway (English)
- Österreich (Deutsch)
- Portugal (English)
- Sweden (English)
- Switzerland
- United Kingdom (English)