Create Fault Trees in the Safety Analysis Manager
R2026bFault tree analysis can help you determine the likelihood of a failure in a design due to the occurrence of one or more related events. The analysis can often uncover dependencies and event significance that might not be obvious. Additionally, safety standards such as ISO 26262 and ARP 4761 often require fault tree analysis.
You can create and analyze fault trees in the Safety Analysis Manager. When you create fault trees, you can manually define the structure and then calculate relevant metrics. These metrics include the probability and frequency at the top-level gate, and cutsets in the fault tree. In this tutorial, you construct a simple fault tree, calculate the probability of failure at the top-level gate, and investigate the results.
Create the Fault Tree
To create a new fault tree, open the Safety Analysis Manager. In the Apps tab, click Safety Analysis Manager.

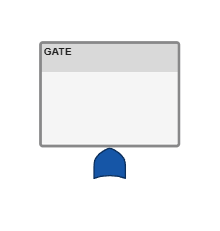
Create a new fault tree document. In the New section, click Empty Fault Tree Document. The new fault tree document has one fault tree that contains a top-level gate.
To add more fault trees to this document, in the File section, click New > Fault Tree Document.
Create Gates and Events
Fault trees contain gates and events. Events represent low-level failures in your design. You characterize events by defining a failure model. For each event, the Safety Analysis Manager calculates the probability that each event occurs, also known as the event unavailability, and the frequency that each event can occur. Gates then propagate the unavailability and frequency information up the tree to the top-level gate.
To propagate the unavailability and frequency up the tree, gates perform set algebra on the inputs they receive. Gates represent these calculations as equivalent Boolean logical operations.
Add Gates to Fault Tree
In this example, the tree has only one top-level gate. Add two gates to the top-level gate. Select the top-level gate. In the Tree section, click Or two times. The fault tree now has two or gates.
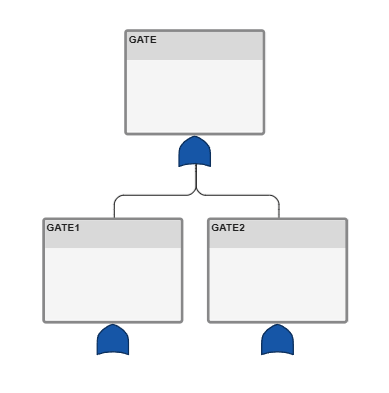
In the Properties pane, you can also specify additional properties, such as the type of gate, and its name. For more information, see Create Fault Tree Gates.
Add Events to Fault Tree
You can assign gates or events as inputs to other gates. Add two events to each gate.
Select the gate labeled
GATE1.In the Tree section, click Basic twice.
Repeat this process for
GATE2.
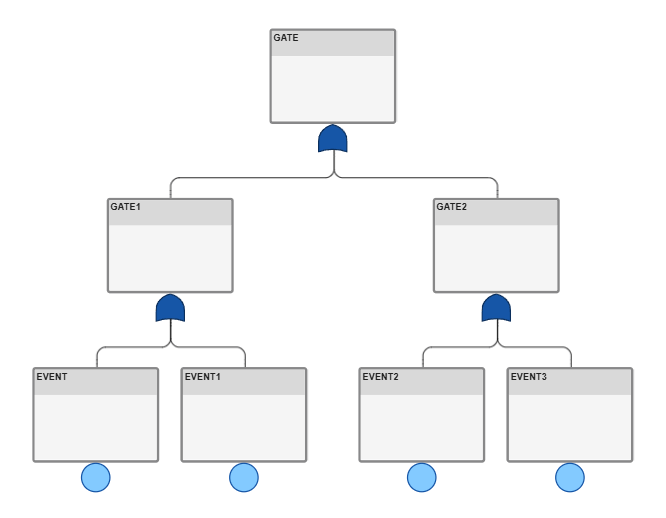
To change an existing event and its properties, select the event and, in the Properties pane, change the Type property. For more information, see Create Fault Tree Events.
Define Event Properties
To determine unavailability and frequency at the top-level gate, you must specify the failure model for each event in the tree. For more information on failure modes and their properties, see Define Event Properties. In this example, modify the probability and frequency for the events:
Select the event. The Properties pane displays the event properties.
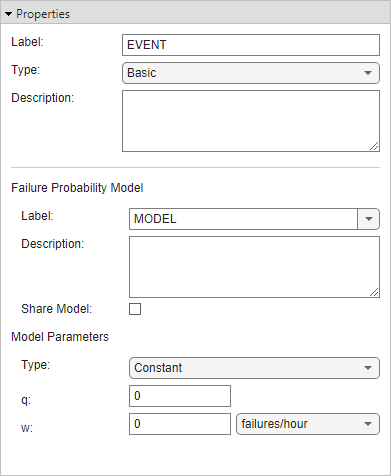
The q property represents the failure probability and the w property represents the frequency. Set q to
0.05and w to0.05.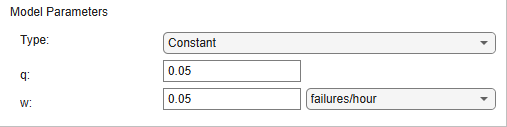
Repeat these steps to set the values of q and w for each event:
Event Name q Value w Value Event10.050.1Event20.10.1Event30.10.15
Delete Fault Tree Artifacts
To delete a gate or event, select the artifact and, in the Edit section, click Delete. Deleting a gate that has inputs also deletes the inputs.
Evaluate the Fault Tree Document
After you create gates and events, you can calculate the probability that the top-level gate occurs. In the Tree section, click Evaluate Tree > Configure Evaluation. The Evaluation Configuration window opens.
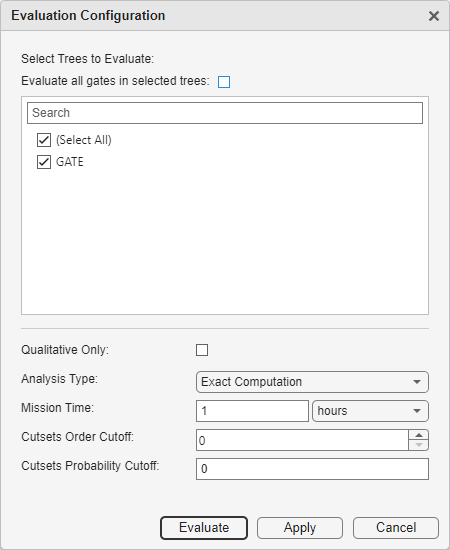
You specify the evaluation properties here, such as which fault trees to evaluate and the algorithm that you use to evaluate the document. For more information on evaluating fault trees, see Evaluate Fault Tree Documents.
In this example, do not change the default settings, and click
Evaluate. The tree populates the events and the top-level gate
with the resulting q values.
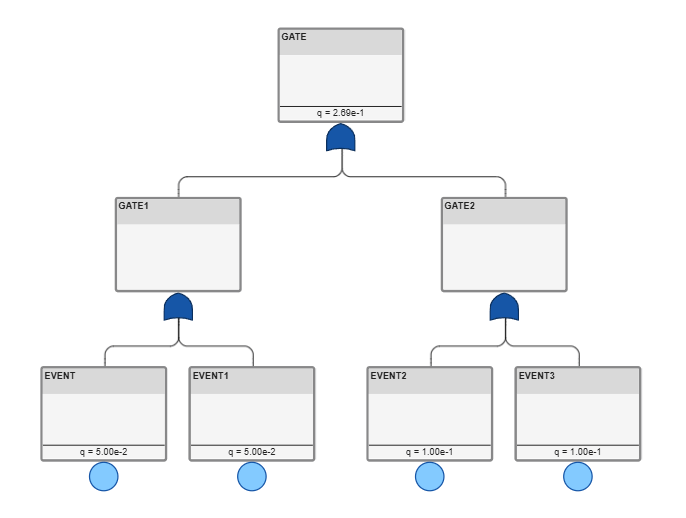
To view the q value at the GATE1 and
GATE2 gates, select the gate and, in the
Properties pane, enable the Compute
Properties property. Then reevaluate the fault tree document.
View Fault Tree Document Cutsets
After evaluating a fault tree, the Safety Analysis Manager displays the
cutsets of the tree. A cutset is a viable path of events that could activate the
specified gate. To view the cutsets, in the Artifacts pane, set the
drop-down list in the top-left corner to Results, and then
set the second drop-down list to Cutsets. Each cutset lists
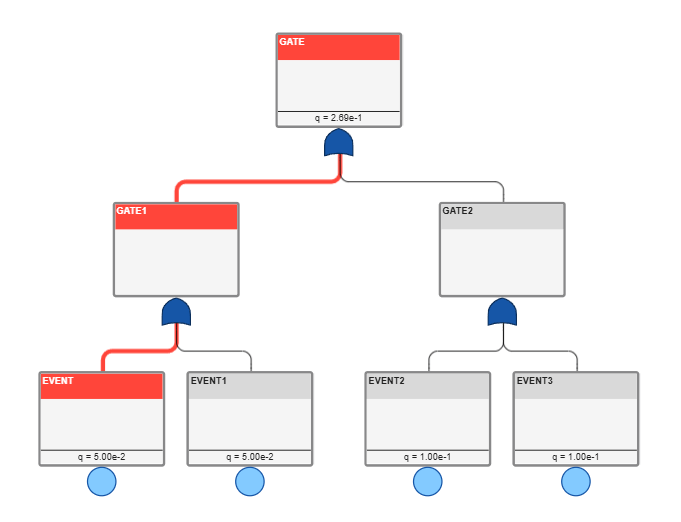
the responsible events. To view a cutset, select a cutset from the list and click the
Trace cutset button . This image shows the cutset associated with the
event named EVENT.
See Also
Topics
- Define and Model Faults
- Create Spreadsheets in the Safety Analysis Manager
- Create Fault Tree Events
- Create Fault Tree Gates
- Organize Fault Trees in Fault Tree Documents
- Link Safety Analysis Manager Fault Tree Artifacts to Requirements, Tests, and Faults
- Export Fault Trees to PDFs
- Create and Evaluate Fault Trees Programmatically

