fanplot
Plot combined historical and forecast data to visualize possible outcomes
Syntax
Description
fanplot(
generates a fan chart. In time series analysis, a fan chart is a chart that
joins a simple line chart for observed past data with ranges for possible values
of future data. The historical data and possible future data are joined with a
line showing a central estimate or most likely value for the future
outcomes.historical,forecast)
fanplot supports three plotting scenarios:
Matching — This scenario occurs when the time period perfectly matches for
historicalandforecastdata.Backtest — This scenario occurs when there are overlaps between
historicalandforecastdata.Gap — This scenario occurs when there are
NaNvalues in thehistoricalorforecastdata.
fanplot(___,
generates a fan chart using optional name-value arguments.Name=Value)
fanplot(
generates a fan chart using an optional ax,historical,forecast)ax argument.
h = fanplot(ax,historical,forecast)h. In
time series analysis, a fan chart is a chart that joins a simple line chart for
observed past data with ranges for possible values of future data. The
historical data and possible future data are joined with a line showing a
central estimate or most likely value for the future outcomes.
fanplot supports three plotting scenarios:
Matching — This scenario occurs when the time period perfectly matches for
historicalandforecastdata.Backtest — This scenario occurs when there are overlaps between
historicalandforecastdata.Gap — This scenario occurs when there are
NaNvalues in thehistoricalorforecastdata.
[
generates a fan chart and returns the figure handle h,ax] = fanplot(___,Name=Value)h and
axis (ax) using optional name-value arguments.
h = fanplot(ax,[],forecast)h. In
time series analysis, a fan chart is a chart that joins a simple line chart for
observed past data with ranges for possible values of future data. The
historical data and possible future data are joined with a line showing a
central estimate or most likely value for the future outcomes.
Examples
Define the data inputs for historical as a 5-by-2 cell array and forecast as a 5-by-21 cell array with 20 observations.
historical =  {2006    -0.0110
               2007     0.0120
               2008     0.0090
               2009     0.0120
               2010     0.0150};

forecast =    {2011  0.0203      -0.0155     0.0311     -0.0026      0.0035    0.0049      0.0026    0.0298    -0.0212      0.0128    ...
                     0.0533       0.0139     0.0037     -0.0727     -0.0291   -0.0058      0.0183    0.0490     0.0072     -0.0604;
               2012  0.0430      -0.0094     0.0587      0.0095      0.0185    0.0205      0.0172    0.0569    -0.0177      0.0320    ...
                     0.0141       0.0337     0.0187      0.0132     -0.0292    0.0048      0.0400    0.0126     0.0239      0.0124;
               2013  0.0518      -0.0116     0.0708      0.0112      0.0221    0.0246      0.0205    0.0686    -0.0217      0.0385    ...
                     0.0168       0.0405     0.0224      0.0157     -0.0356    0.0056      0.0482    0.0150     0.0286      0.0148;
               2014  0.0546      -0.0171     0.0762      0.0088      0.0210    0.0239      0.0193    0.0737    -0.0285      0.0396    ...
                     0.0151       0.0419     0.0214      0.0139     -0.0442    0.0024      0.0506    0.0130     0.0284      0.0128;
               2015  0.0565      -0.0207     0.0797      0.0072      0.0203    0.0234      0.0185    0.0770    -0.0329      0.0404    ...
                     0.0139       0.0428     0.0207      0.0126     -0.0499    0.0026      0.0522    0.0117     0.0283      0.0115};
Generate the fan chart.
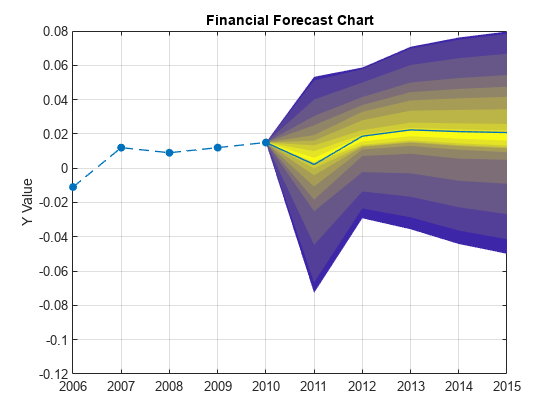
fanplot (historical, forecast);

The dotted points are the historical lines and the filled lines indicate the mean for the forecasts. This fanplot represents a matching scenario where the time period perfectly matches for the historical and forecast data.
Define the data inputs for historical as a 5-by-2 matrix and forecast as a 5-by-21 matrix with 20 observations.
historical = [ 1.0000 2.8046 ;
2.0000 4.1040 ;
3.0000 6.7292 ;
4.0000 8.6486 ;
5.0000 10.4747 ];
forecast = [ 3.0000 28.9874 18.3958 19.6376 29.5627 8.3462 7.1502 25.3845 2.2963 8.0517 13.1328 19.5155 14.7369 , ...
20.8557 27.0691 23.0803 20.7885 18.0205 17.2294 10.0197 29.4254 ;
4.0000 4.8933 27.2659 7.2206 24.4703 10.5895 15.0212 29.1137 6.3784 10.2638 11.0671 12.6656 4.3285 , ...
8.0007 18.7114 19.1691 24.5963 4.2835 4.0676 3.2612 29.5784 ;
5.0000 20.9732 19.7069 11.6862 25.7018 31.8940 7.2664 19.2113 10.0001 31.5482 25.7193 13.8881 30.1476 , ...
31.7996 3.6419 3.2695 27.1422 10.5487 32.6529 18.8370 6.6373 ;
6.0000 11.0069 29.1965 4.5551 20.2627 10.9209 15.2675 28.5359 11.4010 14.4001 14.7923 6.0546 12.4509 , ...
23.9532 18.4804 25.5484 4.8747 8.0036 11.5329 11.6807 21.7583 ;
7.0000 5.9699 11.1486 26.0449 13.4619 21.1196 28.8068 26.2525 10.1085 13.9197 8.7470 31.0149 23.4163 , ...
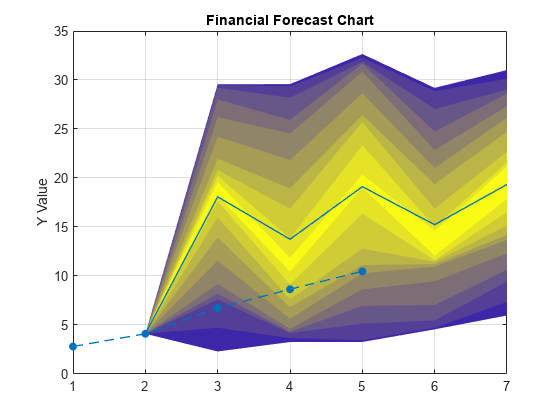
21.2390 29.2396 18.4828 28.3945 21.9342 14.4642 17.2613 15.7896 ];Generate the fan chart and return the figure handle (h) and axis object (ax).
[h,ax] = fanplot(historical, forecast)
h =
  Figure (1) with properties:

      Number: 1
        Name: ''
       Color: [1 1 1]
    Position: [161 234 560 337.1114]
       Units: 'pixels'

  Show all properties
ax =
  Axes (Financial Forecast Chart) with properties:

             XLim: [1 7]
             YLim: [0 35]
           XScale: 'linear'
           YScale: 'linear'
    GridLineStyle: '-'
         Position: [0.1300 0.1100 0.7750 0.8150]
            Units: 'normalized'

  Show all properties
The dotted points are the historical lines and the filled lines indicate the mean for the forecasts. This fanplot represents a backtest scenario where there is an overlap between the historical and forecast data.
Define the data inputs for historical as a 5-by-2 cell array and forecast as a 5-by-21 cell array with 20 observations.
historical =  {2006    -0.0110
               2007     0.0120
               2008     0.0090
               2009     0.0120
               2010     0.0150};

forecast =    {2011  0.0203      -0.0155     0.0311     -0.0026      0.0035    0.0049      0.0026    0.0298    -0.0212      0.0128    ...
                     0.0533       0.0139     0.0037     -0.0727     -0.0291   -0.0058      0.0183    0.0490     0.0072     -0.0604;
               2012  0.0430      -0.0094     0.0587      0.0095      0.0185    0.0205      0.0172    0.0569    -0.0177      0.0320    ...
                     0.0141       0.0337     0.0187      0.0132     -0.0292    0.0048      0.0400    0.0126     0.0239      0.0124;
               2013  0.0518      -0.0116     0.0708      0.0112      0.0221    0.0246      0.0205    0.0686    -0.0217      0.0385    ...
                     0.0168       0.0405     0.0224      0.0157     -0.0356    0.0056      0.0482    0.0150     0.0286      0.0148;
               2014  0.0546      -0.0171     0.0762      0.0088      0.0210    0.0239      0.0193    0.0737    -0.0285      0.0396    ...
                     0.0151       0.0419     0.0214      0.0139     -0.0442    0.0024      0.0506    0.0130     0.0284      0.0128;
               2015  0.0565      -0.0207     0.0797      0.0072      0.0203    0.0234      0.0185    0.0770    -0.0329      0.0404    ...
                     0.0139       0.0428     0.0207      0.0126     -0.0499    0.0026      0.0522    0.0117     0.0283      0.0115};
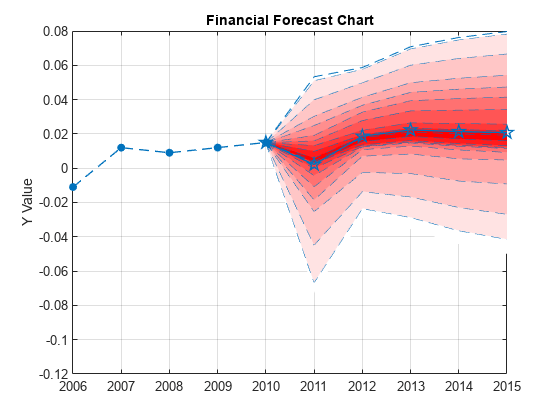
Generate the fan chart using name-value arguments to customize the presentation.
fanplot(historical,forecast,'FanFaceColor',[1 1 1;1 0 0],'FanLineStyle','--','ForecastMarker','p','ForecastMarkerSize',10)
Create table of historical dates and data.
historicalDates = datetime(2006:2010,1,1)';
historicalData = [-0.0110;0.0120;0.0090;0.0120;0.0150];
historical = table(historicalDates,historicalData,'VariableNames',{'Dates','Data'});
Create table of forecast dates and data.
forecastDates = datetime(2011:2015,1,1)';
forecastData =      [0.0203      -0.0155    0.0311    -0.0026      0.0035    0.0049      0.0026    0.0298    -0.0212       0.0128    ...
                     0.0533       0.0139    0.0037    -0.0727     -0.0291   -0.0058      0.0183    0.0490     0.0072      -0.0604;
                     0.0430      -0.0094    0.0587     0.0095      0.0185    0.0205      0.0172    0.0569    -0.0177       0.0320    ...
                     0.0141       0.0337    0.0187     0.0132     -0.0292    0.0048      0.0400    0.0126     0.0239       0.0124;
                     0.0518      -0.0116    0.0708     0.0112      0.0221    0.0246      0.0205    0.0686    -0.0217       0.0385    ...
                     0.0168       0.0405    0.0224     0.0157     -0.0356    0.0056      0.0482    0.0150     0.0286       0.0148;
                     0.0546      -0.0171    0.0762     0.0088      0.0210    0.0239      0.0193    0.0737    -0.0285       0.0396    ...
                     0.0151       0.0419    0.0214     0.0139     -0.0442    0.0024      0.0506    0.0130     0.0284       0.0128;
                     0.0565      -0.0207    0.0797     0.0072      0.0203    0.0234      0.0185    0.0770    -0.0329       0.0404    ...
                     0.0139      0.0428     0.0207     0.0126     -0.0499    0.0026      0.0522    0.0117     0.0283       0.0115];
forecast = [table(forecastDates,'VariableName',{'Dates'}),array2table(forecastData)];
Plot the data using fanplot and use the Quantiles name-value argument to find the 90th percentile.
fanplot(historical,forecast,Quantiles=0.9);
Since R2026a
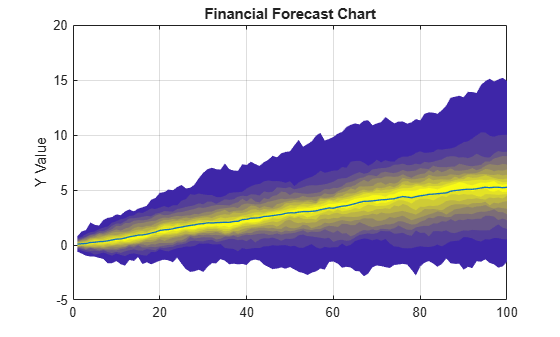
This example shows how to generate a fan chart using only forecast data.
rng default
N = 100; M = 100;
ret = rand(N,1)*.1;
data = cumsum(randn(N,M)*.3 + repmat(ret,1,M));
years = (1:N)';
forecastdata2 = [years,data];

% Generate fan chart
history = [];
fanplot(history,forecastdata2)
You can change the chart title.
[~,ax] = fanplot([],forecastdata2);
title(ax,'Price Index')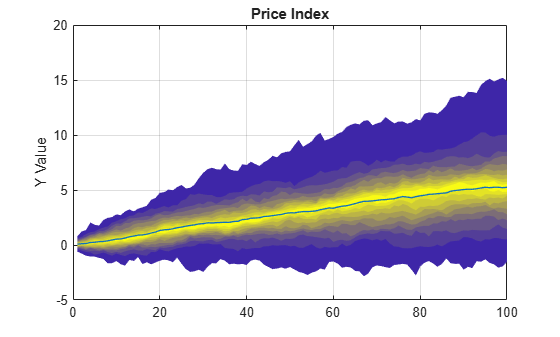
Use the CenterLineType name-value argument to specify the type of center line.
fanplot([],forecastdata2,CenterLineType="median")
Use the TransparencyAlpha name-value argument to adjust the transparency of the fan.
fanplot([],forecastdata2,TransparencyAlpha=0.4)

Use the FanFaceColor name-value argument to specify a different colormap.
colors = [254 230 222
    252 211 196
    250 190 171
    248 170 148
    246 151 127
    244 132 108
    243 113 92
    241 91 75
    237 27 46]/256;

fanplot([],forecastdata2,FanFaceColor=colors,Quantiles=(5:5:95)/100)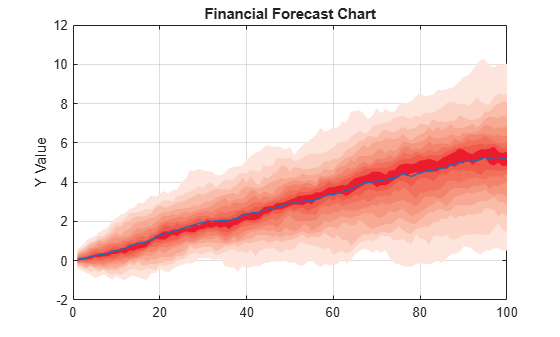
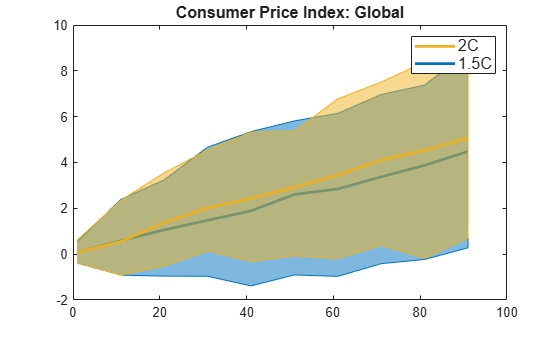
In addition, using fanplot you can plot multiple scenarios on a single axis and create a legend.
ret = rand(N,1)*.1;
data3 = cumsum(randn(N,M)*.3 + repmat(ret,1,M));
data4 = [years data3];

colors = [ 0    0.4471    0.7412 % blue
           0.9294    0.6941    0.1255];

[~,ax]=fanplot([],data4(1:10:end,:),TransparencyAlpha=0.5,FanFaceColor=colors(1,:),Quantiles=[5 95]/100,ForecastLineWidth=2,FanLineStyle='-',ForecastLineColor=colors(1,:),FanLineColor=colors(1,:));
hold(ax,'on')
grid(ax,'off')
fanplot(ax,[], forecastdata2(1:10:end,:),TransparencyAlpha=0.5,FanFaceColor=colors(2,:),Quantiles=[5 95]/100,ForecastLineWidth=2,FanLineStyle='-',ForecastLineColor=colors(2,:),FanLineColor=colors(2,:))
title(ax,'Consumer Price Index: Global','FontSize',12)
legend(findall(ax,'Tag','CenterLine'),["2C","1.5C"],'FontSize',12)
ylabel(ax,'')