Impute Missing Data in the Credit Scorecard Workflow Using the k-Nearest Neighbors Algorithm
This example shows how to perform imputation of missing data in the credit scorecard workflow using the k-nearest neighbors (kNN) algorithm.
The kNN algorithm is a nonparametric method used for classification and regression. In both cases, the input consists of the k-closest training examples in the feature space. The output depends on whether kNN is used for classification or regression. In kNN classification, an object is classified by a plurality vote of its neighbors, and the object is assigned to the class most common among its k-nearest neighbors. In kNN regression, the output is the average of the values of k-nearest neighbors. For more information on the kNN algorithm, see fitcknn.
For additional information on alternative approaches for "treating" missing data, see Credit Scorecard Modeling with Missing Values.
Impute Missing Data Using kNN Algorithm
Use the dataMissing data set to impute missing values for the CustAge (numeric) and ResStatus (categorical) predictors.
load CreditCardData.mat
disp(head(dataMissing));
CustID CustAge TmAtAddress ResStatus EmpStatus CustIncome TmWBank OtherCC AMBalance UtilRate status
______ _______ ___________ ___________ _________ __________ _______ _______ _________ ________ ______
1 53 62 <undefined> Unknown 50000 55 Yes 1055.9 0.22 0
2 61 22 Home Owner Employed 52000 25 Yes 1161.6 0.24 0
3 47 30 Tenant Employed 37000 61 No 877.23 0.29 0
4 NaN 75 Home Owner Employed 53000 20 Yes 157.37 0.08 0
5 68 56 Home Owner Employed 53000 14 Yes 561.84 0.11 0
6 65 13 Home Owner Employed 48000 59 Yes 968.18 0.15 0
7 34 32 Home Owner Unknown 32000 26 Yes 717.82 0.02 1
8 50 57 Other Employed 51000 33 No 3041.2 0.13 0
In this example, the 'CustID' and 'status' columns are removed in the imputation process as those are the id and response values respectively. Alternatively, you can choose to leave the 'status' column in.
dataToImpute = dataMissing(:,setdiff(dataMissing.Properties.VariableNames,...
    {'CustID','status'},'stable'));
Create dummy variables for all categorical predictors so that the kNN algorithm can compute the Euclidean distances.
dResStatus = dummyvar(dataToImpute.ResStatus);
dEmpStatus = dummyvar(dataToImpute.EmpStatus);
dOtherCC = dummyvar(dataToImpute.OtherCC);
'k' in the kNN algorithm is based on feature similarity. Choosing the right value of 'k' is a process called parameter tuning, which is important for greater accuracy. There is no physical way to determine the "best" value for 'k', so you have to try a few values before settling on one. Small values of 'k' can be noisy and subject to the effects of outliers. Larger values of 'k' have smoother decision boundaries, which mean lower variance but increased bias.
For the purpose of this example, choose 'k' as the square root of the number of samples in the data set. This is a generally accepted value for 'k'. Choose a value of 'k' that is odd in order to break a tie between two classes of data.
numObs = height(dataToImpute);
k = round(sqrt(numObs));
if ~mod(k,2)
    k = k+1;
end
Get the missing values from the CustAge and ResStatus predictors.
missingResStatus = ismissing(dataToImpute.ResStatus);
missingCustAge = ismissing(dataToImpute.CustAge);
Next, follow these steps:
custAgeToImpute = dataToImpute;
custAgeToImpute.HomeOwner = dResStatus(:,1);
custAgeToImpute.Tenant = dResStatus(:,2);
custAgeToImpute.Employed = dEmpStatus(:,1);
custAgeToImpute.HasOtherCC = dOtherCC(:,2);
custAgeToImpute = removevars(custAgeToImpute, 'ResStatus');
custAgeToImpute = removevars(custAgeToImpute, 'EmpStatus');
custAgeToImpute = removevars(custAgeToImpute, 'OtherCC');

knnCustAge = fitcknn(custAgeToImpute, 'CustAge', 'NumNeighbors', k, 'Standardize',true);
imputedCustAge = predict(knnCustAge,custAgeToImpute(missingCustAge,:));

resStatusToImpute = dataToImpute;
resStatusToImpute.Employed = dEmpStatus(:,1);
resStatusToImpute.HasOtherCC = dOtherCC(:,2);
resStatusToImpute = removevars(resStatusToImpute, 'EmpStatus');
resStatusToImpute = removevars(resStatusToImpute, 'OtherCC');

knnResStatus = fitcknn(resStatusToImpute, 'ResStatus', 'NumNeighbors', k, 'Standardize', true);
imputedResStatus = predict(knnResStatus,resStatusToImpute(missingResStatus,:));
Compare Imputed Data to Original Data
Create a new data set with the imputed data.
knnImputedData = dataMissing;
knnImputedData.CustAge(missingCustAge) = imputedCustAge;
knnImputedData.ResStatus(missingResStatus) = imputedResStatus;
disp(knnImputedData(5:10,:));
    CustID    CustAge    TmAtAddress    ResStatus     EmpStatus    CustIncome    TmWBank    OtherCC    AMBalance    UtilRate    status
    ______    _______    ___________    __________    _________    __________    _______    _______    _________    ________    ______

       5        68           56         Home Owner    Employed       53000         14         Yes       561.84        0.11        0
       6        65           13         Home Owner    Employed       48000         59         Yes       968.18        0.15        0
       7        34           32         Home Owner    Unknown        32000         26         Yes       717.82        0.02        1
       8        50           57         Other         Employed       51000         33         No        3041.2        0.13        0
       9        50           10         Tenant        Unknown        52000         25         Yes       115.56        0.02        1
      10        49           30         Home Owner    Unknown        53000         23         Yes        718.5        0.17        1
disp(knnImputedData(find(missingCustAge,5),:));
    CustID    CustAge    TmAtAddress    ResStatus     EmpStatus    CustIncome    TmWBank    OtherCC    AMBalance    UtilRate    status
    ______    _______    ___________    __________    _________    __________    _______    _______    _________    ________    ______

       4        52           75         Home Owner    Employed       53000         20         Yes       157.37        0.08        0
      19        45           14         Home Owner    Employed       51000         11         Yes       519.46        0.42        1
     138        41           31         Other         Employed       41000          2         Yes       1101.8        0.32        0
     165        37           21         Home Owner    Unknown        38000         70         No          1217         0.2        0
     207        48           38         Home Owner    Employed       48000         12         No         573.9         0.1        0
disp(knnImputedData(find(missingResStatus,5),:));
    CustID    CustAge    TmAtAddress    ResStatus     EmpStatus    CustIncome    TmWBank    OtherCC    AMBalance    UtilRate    status
    ______    _______    ___________    __________    _________    __________    _______    _______    _________    ________    ______

       1        53           62         Tenant        Unknown        50000         55         Yes       1055.9        0.22        0
      22        51           13         Tenant        Employed       35000         33         Yes       468.85        0.01        0
      33        46            8         Home Owner    Unknown        32000         26         Yes       940.78         0.3        0
      47        52           56         Tenant        Employed       56000         79         Yes       294.46        0.12        0
     103        64           49         Tenant        Employed       50000         35         Yes       118.43           0        0
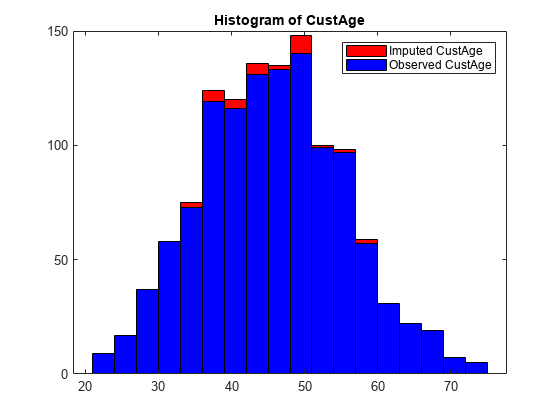
Plot a histogram of the predictor values before and after imputation.
Predictor ="CustAge"; f1 = figure; ax1 = axes(f1); histogram(ax1,knnImputedData.(Predictor),'FaceColor','red','FaceAlpha',1); hold on histogram(ax1,dataMissing.(Predictor),'FaceColor','blue','FaceAlpha',1); legend(strcat("Imputed ", Predictor), strcat("Observed ", Predictor)); title(strcat("Histogram of ", Predictor));
Create Credit Scorecard Model Using New Imputed Data
Use the imputed data to create the creditscorecard object, and then use autobinning, fitmodel, and formatpoints to create a credit scorecard model.
sc = creditscorecard(knnImputedData,'IDVar','CustID');
sc = autobinning(sc);
[sc,mdl] = fitmodel(sc,'display','off');
sc = formatpoints(sc,'PointsOddsAndPDO',[500 2 50]);
PointsInfo = displaypoints(sc);
disp(PointsInfo);
      Predictors               Bin             Points
    ______________    _____________________    ______

    {'CustAge'   }    {'[-Inf,33)'        }    53.675
    {'CustAge'   }    {'[33,37)'          }    56.983
    {'CustAge'   }    {'[37,40)'          }    57.721
    {'CustAge'   }    {'[40,45)'          }    67.063
    {'CustAge'   }    {'[45,48)'          }    78.319
    {'CustAge'   }    {'[48,51)'          }    79.494
    {'CustAge'   }    {'[51,58)'          }    81.157
    {'CustAge'   }    {'[58,Inf]'         }    97.315
    {'CustAge'   }    {'<missing>'        }       NaN
    {'ResStatus' }    {'Tenant'           }    63.012
    {'ResStatus' }    {'Home Owner'       }     72.35
    {'ResStatus' }    {'Other'            }    92.434
    {'ResStatus' }    {'<missing>'        }       NaN
    {'EmpStatus' }    {'Unknown'          }    58.892
    {'EmpStatus' }    {'Employed'         }     86.83
    {'EmpStatus' }    {'<missing>'        }       NaN
    {'CustIncome'}    {'[-Inf,29000)'     }    30.304
    {'CustIncome'}    {'[29000,33000)'    }    56.365
    {'CustIncome'}    {'[33000,35000)'    }    67.971
    {'CustIncome'}    {'[35000,40000)'    }    70.136
    {'CustIncome'}    {'[40000,42000)'    }    70.936
    {'CustIncome'}    {'[42000,47000)'    }    82.196
    {'CustIncome'}    {'[47000,Inf]'      }    96.405
    {'CustIncome'}    {'<missing>'        }       NaN
    {'TmWBank'   }    {'[-Inf,12)'        }    50.966
    {'TmWBank'   }    {'[12,23)'          }    60.975
    {'TmWBank'   }    {'[23,45)'          }    61.778
    {'TmWBank'   }    {'[45,71)'          }    93.007
    {'TmWBank'   }    {'[71,Inf]'         }    133.39
    {'TmWBank'   }    {'<missing>'        }       NaN
    {'OtherCC'   }    {'No'               }    50.765
    {'OtherCC'   }    {'Yes'              }    75.649
    {'OtherCC'   }    {'<missing>'        }       NaN
    {'AMBalance' }    {'[-Inf,558.88)'    }    89.765
    {'AMBalance' }    {'[558.88,1254.28)' }    63.097
    {'AMBalance' }    {'[1254.28,1597.44)'}    59.725
    {'AMBalance' }    {'[1597.44,Inf]'    }    49.184
    {'AMBalance' }    {'<missing>'        }       NaN
Calculate Scores and Probability of Default for New Applicants
Create a data set of 'new customers' and then calculate the scores and probabilities of default.
dataNewCustomers = dataMissing(1:20,1:end-1);
disp(head(dataNewCustomers));
    CustID    CustAge    TmAtAddress     ResStatus     EmpStatus    CustIncome    TmWBank    OtherCC    AMBalance    UtilRate
    ______    _______    ___________    ___________    _________    __________    _______    _______    _________    ________

      1          53          62         <undefined>    Unknown        50000         55         Yes       1055.9        0.22
      2          61          22         Home Owner     Employed       52000         25         Yes       1161.6        0.24
      3          47          30         Tenant         Employed       37000         61         No        877.23        0.29
      4         NaN          75         Home Owner     Employed       53000         20         Yes       157.37        0.08
      5          68          56         Home Owner     Employed       53000         14         Yes       561.84        0.11
      6          65          13         Home Owner     Employed       48000         59         Yes       968.18        0.15
      7          34          32         Home Owner     Unknown        32000         26         Yes       717.82        0.02
      8          50          57         Other          Employed       51000         33         No        3041.2        0.13
Perform the same preprocessing on the 'new customers' data as on the training data.
dResStatusNewCustomers = dummyvar(dataNewCustomers.ResStatus);
dEmpStatusNewCustomers = dummyvar(dataNewCustomers.EmpStatus);
dOtherCCNewCustomers = dummyvar(dataNewCustomers.OtherCC);

dataNewCustomersCopy = dataNewCustomers;
dataNewCustomersCopy.HomeOwner = dResStatusNewCustomers(:,1);
dataNewCustomersCopy.Tenant = dResStatusNewCustomers(:,2);
dataNewCustomersCopy.Employed = dEmpStatusNewCustomers(:,1);
dataNewCustomersCopy.HasOtherCC = dOtherCCNewCustomers(:,2);
dataNewCustomersCopy = removevars(dataNewCustomersCopy, 'ResStatus');
dataNewCustomersCopy = removevars(dataNewCustomersCopy, 'EmpStatus');
dataNewCustomersCopy = removevars(dataNewCustomersCopy, 'OtherCC');
Predict the missing data in the scoring data set with the same imputation model as before.
missingCustAgeNewCustomers = isnan(dataNewCustomers.CustAge);
missingResStatusNewCustomers = ismissing(dataNewCustomers.ResStatus);
imputedCustAgeNewCustomers = round(predict(knnCustAge, dataNewCustomersCopy(missingCustAgeNewCustomers,:)));
imputedResStatusNewCustomers = predict(knnResStatus, dataNewCustomersCopy(missingResStatusNewCustomers,:));
dataNewCustomers.CustAge(missingCustAgeNewCustomers) = imputedCustAgeNewCustomers;
dataNewCustomers.ResStatus(missingResStatusNewCustomers) = imputedResStatusNewCustomers;
Use score to calculate scores of new customers.
[scores, points] = score(sc, dataNewCustomers);
disp(scores);
  531.2201
  553.4261
  505.1671
  563.1321
  552.6226
  584.6546
  445.1156
  516.8917
  524.9965
  507.6668
  498.2255
  539.4057
  516.4594
  491.6344
  566.1685
  486.8248
  476.0595
  469.5488
  550.2850
  511.0285
disp(points);
    CustAge    ResStatus    EmpStatus    CustIncome    TmWBank    OtherCC    AMBalance
    _______    _________    _________    __________    _______    _______    _________

    81.157      63.012       58.892        96.405      93.007     75.649      63.097
    97.315       72.35        86.83        96.405      61.778     75.649      63.097
    78.319      63.012        86.83        70.136      93.007     50.765      63.097
    81.157       72.35        86.83        96.405      60.975     75.649      89.765
    97.315       72.35        86.83        96.405      60.975     75.649      63.097
    97.315       72.35        86.83        96.405      93.007     75.649      63.097
    56.983       72.35       58.892        56.365      61.778     75.649      63.097
    79.494      92.434        86.83        96.405      61.778     50.765      49.184
    79.494      63.012       58.892        96.405      61.778     75.649      89.765
    79.494       72.35       58.892        96.405      61.778     75.649      63.097
    81.157      63.012       58.892        67.971      61.778     75.649      89.765
    79.494      92.434       58.892        82.196      60.975     75.649      89.765
    97.315       72.35       58.892        96.405      50.966     50.765      89.765
    67.063      92.434       58.892        70.936      61.778     50.765      89.765
    78.319      92.434        86.83        82.196      60.975     75.649      89.765
    56.983       72.35        86.83        70.136      61.778     75.649      63.097
    57.721      63.012        86.83        67.971      61.778     75.649      63.097
    53.675       72.35        86.83        30.304      60.975     75.649      89.765
    78.319       72.35        86.83        96.405      50.966     75.649      89.765
    81.157      92.434       58.892        82.196      60.975     75.649      59.725