label2rgb
Convert label matrix into RGB image
Syntax
Description
RGB = label2rgb(L)L into an RGB color image for the
purpose of visualizing the labeled regions. The label2rgb
function determines the color to assign to each object based on the number of
objects in the label matrix. The label2rgb function picks
colors from the entire range of the colormap.
RGB = label2rgb(L,cmap,zerocolor,colorAssignment)label2rgb assigns colors to regions in the label
matrix.
RGB = label2rgb(___,OutputFormat=outputFormat)
Examples
Read and display an image.
I = imread("rice.png");
imshow(I)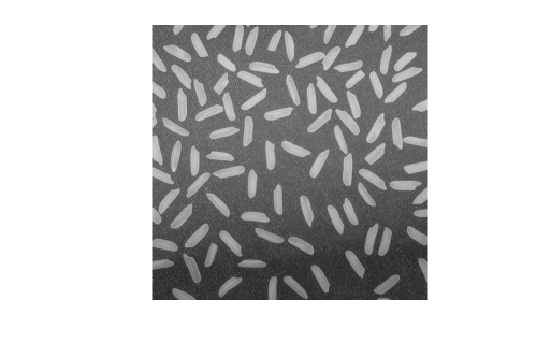
Create a label matrix from the image.
BW = imbinarize(I);
CC = bwconncomp(BW);
L = labelmatrix(CC);
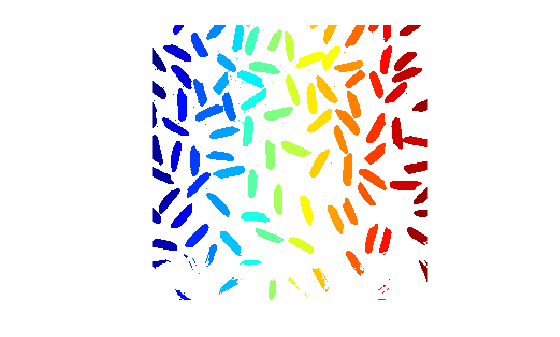
Convert the label matrix into an RGB image, using default settings. Background pixels are white.
RGB = label2rgb(L);
imshow(RGB)
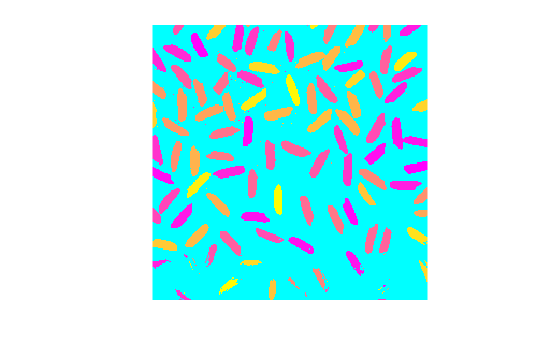
Convert the label matrix into an RGB image, specifying optional parameters. This example uses the "spring" colormap, sets background pixels to the color cyan, and randomizes how colors are assigned to the labels.
RGB2 = label2rgb(L,"spring","c","shuffle");
imshow(RGB2)
Input Arguments
Label image of contiguous regions, specified as one of the following.
A matrix of nonnegative integers. Pixels labeled
0are the background. Pixels labeled1make up one object; pixels labeled2make up a second object; and so on. You can get a numeric label image from labeling functions such aswatershedorlabelmatrix.A categorical matrix.
Data Types: single | double | int8 | int16 | int32 | int64 | uint8 | uint16 | uint32 | uint64 | logical | categorical
Colormap to be used in the generated color image RGB,
specified as one of the following.
Value | Description |
|---|---|
c-by-3 matrix of data type
double | Colormap matrix specifying c
colors, each as an RGB triple. c
must be greater than or equal to the number of
labels, numlabels, in label
matrix If
c is greater than
numlabels, then
|
| colormap function | Name of a MATLAB® colormap function, such as
|
| colormap handle | Handle of a colormap function, such as
|
Fill color, specified as an RGB triplet, a hexadecimal color code, a color
name, or a short color name. label2rgb applies the
fill color to the label 0 for numeric label images or the
label <undefined> for categorical label images.
For a custom color, specify an RGB triplet or a hexadecimal color code.
An RGB triplet is a three-element row vector whose elements specify the intensities of the red, green, and blue components of the color. The intensities must be in the range
[0,1], for example,[0.4 0.6 0.7].A hexadecimal color code is a string scalar or character vector that starts with a hash symbol (
#) followed by three or six hexadecimal digits, which can range from0toF. The values are not case sensitive. Therefore, the color codes"#FF8800","#ff8800","#F80", and"#f80"are equivalent.
Alternatively, you can specify some common colors by name. This table lists the named color options, the equivalent RGB triplets, and the hexadecimal color codes.
| Color Name | Short Name | RGB Triplet | Hexadecimal Color Code | Appearance |
|---|---|---|---|---|
"red" | "r" | [1 0 0] | "#FF0000" |
|
"green" | "g" | [0 1 0] | "#00FF00" |
|
"blue" | "b" | [0 0 1] | "#0000FF" |
|
"cyan"
| "c" | [0 1 1] | "#00FFFF" |
|
"magenta" | "m" | [1 0 1] | "#FF00FF" |
|
"yellow" | "y" | [1 1 0] | "#FFFF00" |
|
"black" | "k" | [0 0 0] | "#000000" |
|
"white" | "w" | [1 1 1] | "#FFFFFF" |
|
This table lists the default color palettes for plots in the light and dark themes.
| Palette | Palette Colors |
|---|---|
Before R2025a: Most plots use these colors by default. |
|
|
|
You can get the RGB triplets and hexadecimal color codes for these palettes using the
orderedcolors
and rgb2hex
functions. For example, get the RGB triplets for the "gem" palette and
convert them to hexadecimal color
codes.
RGB = orderedcolors("gem");
H = rgb2hex(RGB);
Before R2023b: Get the RGB triplets using RGB =
get(groot,"FactoryAxesColorOrder").
Color assignment, specified as one of these values.
"noshuffle"— Assign colormap colors to label matrix regions in numerical order. Each region has a unique color."shuffle"— Assign colormap colors pseudorandomly. Each region has a unique color."contrasting-neighbors"(since R2025a) — Assign a subset of colormap colors to maximize contrast between adjacent regions. Each color can correspond to multiple labels.
Output format of the RGB data returned in RGB,
specified as one of the following.
"image"— Return an RGB image. If the size of the input label matrixLisM-by-N, then the size of the output RGB image isM-by-N-by-3."triplets"— Return a list of RGB colors. The size of the output is aC-by-3 matrix containing an RGB triplet for each of theClabels in the input label matrix.
Output Arguments
Extended Capabilities
Version History
Introduced before R2006aSee Also
bwconncomp | bwlabel | bwlabeln | colormap | ismember | labelmatrix | watershed
Topics
- Get Started with Image Segmentation
- Get Started with Semantic Segmentation Using Deep Learning (Computer Vision Toolbox)