plotChromaticity
Plot color reproduction on chromaticity diagram
Description
plotChromaticity( plots on a
chromaticity diagram the measured and reference colors,
colorValues)colorValues, for color patch regions of interest (ROIs) in
a test chart.
plotChromaticity plots an empty chromaticity diagram.
plotChromaticity(___,
adjusts aspects of the display using name-value arguments.Name=Value)
Examples
This example shows how to display the chromaticity diagram from measurements of color accuracy on an Imatest® eSFR chart.
Read an image of an eSFR chart into the workspace.
I = imread("eSFRTestImage.jpg");Create an esfrChart object. Display the chart, highlighting the 16 color patches.
chart = esfrChart(I);
displayChart(chart,displayEdgeROIs=false, ...
    displayGrayROIs=false,displayRegistrationPoints=false)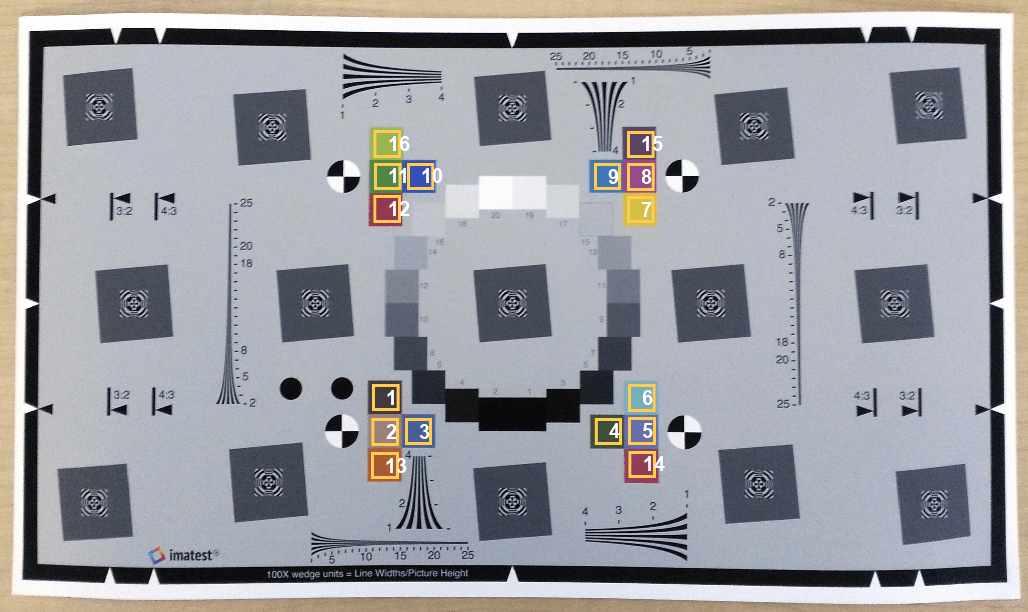
Measure the color in all color patch ROIs.
colorTable = measureColor(chart);
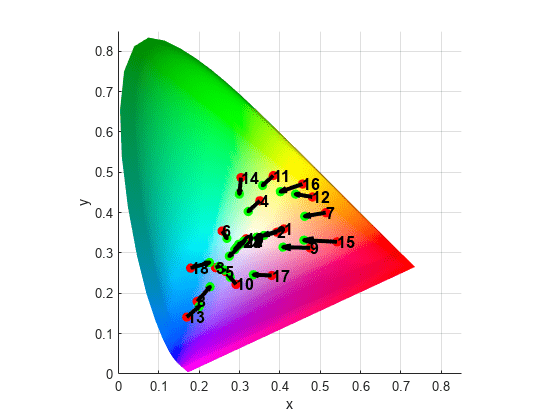
Plot the measured and reference colors in the CIE 1976 L*a*b* color space on a chromaticity diagram. Red circles indicate the reference color and green circles indicate the measured color of each color patch. The chromaticity diagram does not portray the brightness of color.
figure
plotChromaticity(colorTable)

Read an image of a ColorChecker® chart into the workspace.
I = imread("colorCheckerTestImage.jpg");Create a colorChecker object, then display the chart with ROI annotations.
chart = colorChecker(I);
displayChart(chart)
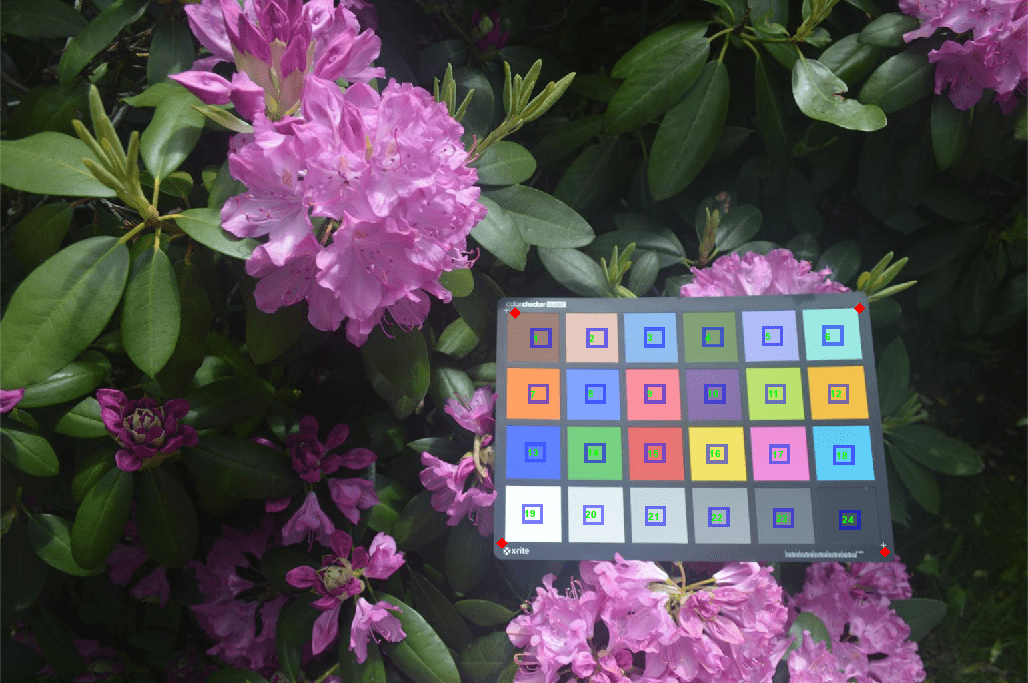
Measure the color in each color patch ROI.
colorTable = measureColor(chart);
Plot the measured and reference colors on a chromaticity diagram.
figure
plotChromaticity(colorTable)
Convert sRGB primary colors to the XYZ color space.
xyz_primaries = rgb2xyz([1 0 0; 0 1 0; 0 0 1]);
Normalize the x and y values of the primary colors.
xyzMag = sum(xyz_primaries,2);
x_primary = xyz_primaries(:,1)./xyzMag;
y_primary = xyz_primaries(:,2)./xyzMag;
Calculate and normalize the D65 white point.
wp = whitepoint('D65');Normalize the x and y values of the white point.
wpMag = sum(wp,2);
x_whitepoint = wp(:,1)./wpMag;
y_whitepoint = wp(:,2)./wpMag;
Create an empty 2-D chromaticity diagram.
plotChromaticity
Add the (x,y) coordinates of the primaries and white point to the chromaticity diagram.
hold on
scatter(x_whitepoint,y_whitepoint,36,'black')
scatter(x_primary,y_primary,36,'black')
plot([x_primary; x_primary],[y_primary; y_primary],'k')
hold off

Display a 3-D color solid of the u'v'L color space on an empty chromaticity diagram. Include all u'v'L colors by specifying the brightness threshold as 0.
plotChromaticity("ColorSpace","uv","View",3,"BrightnessThreshold",0)

Input Arguments
Name-Value Arguments
Tips
The reference L*a*b* values of the
colorValuesmeasured from acolorCheckerobject are for the "After November 2014" version of the ColorChecker® chart. The white point of the reference values is the CIE standard illuminant D50.
Version History
Introduced in R2017b