Create 3-D Displays with Raster Data
This example shows how to create a 3-D display of raster data on an
axesm-based map by setting up surface views, which requires
explicit horizontal coordinates. The simplest way to display raster data is to assign
colors to matrix elements according to their data values and view them in two
dimensions. Raster data maps also can be displayed as 3-D surfaces using the matrix
values as the z data. The difference between regular raster data
and a geolocated data grid is that each grid intersection for a geolocated grid is
explicitly defined with x-y or latitude/longitude matrices or is interpolated from a
graticule, while a regular matrix only implies these locations (which is why it needs a
reference object).
Display Elevation Data in 3-D
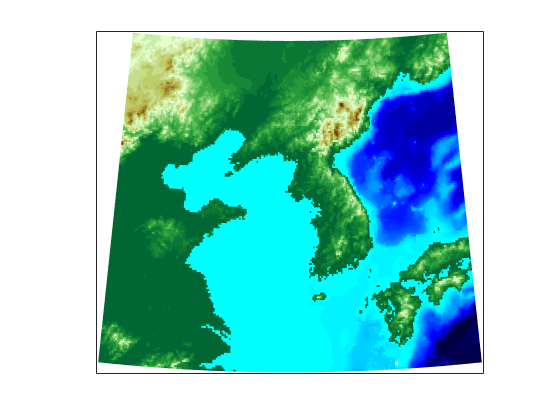
Load elevation data and a geographic cells reference object for the Korean peninsula. Transform the data and reference object to a fully geolocated data grid using the geographicGrid function.
load korea5c
[lat,lon] = geographicGrid(korea5cR);
Next use the km2deg function to convert the units of elevation from meters to degrees, so they are commensurate with the latitude and longitude coordinate matrices.
korea5c = km2deg(korea5c/1000);
Observe the results by using the whos command. The lat and lon coordinate matrices form a mesh the same size as korea5c. This is a requirement for constructing 3-D surfaces. In lon, all columns contain the same number for a given row, and in lat, all rows contain the same number for a given column.
whos lat lon korea5c
  Name           Size              Bytes  Class     Attributes

  korea5c      180x240            345600  double
  lat          180x240            345600  double
  lon          180x240            345600  double
Now set up an axesm-based map with the equal area conic projection and, instead of using the meshm function to make this map, display the geolocated data grid using the surfm function. Set an appropriate colormap. This produces a map that is really a 3-D view seen from directly overhead (the default perspective). To appreciate that, all you need to do is to change your viewpoint.
axesm('MapProjection','eqaconic','MapParallels',[],...
     'MapLatLimit',[30 45],'MapLonLimit',[115 135])
surfm(lat,lon,korea5c,korea5c)
demcmap(korea5c)
tightmap
Specify a viewing azimuth of 60 degrees (from the east southeast) and a viewing elevation of 30 degrees above the horizon, using the view function.
view(60,30)

See Also
Functions
geographicGrid|surfm|axesm