Main Content

geographicGrid

Geographic coordinates of raster elements

Since R2021a

Description

example

[lat,lon] = geographicGrid(R) returns the geographic coordinates of raster elements as the 2-D arrays lat and lon. The coordinates of raster element (i,j) are (lat(i,j),lon(i,j)).

example

[lat,lon] = geographicGrid(R,gridOption), where gridOption is 'gridvectors', returns lat and lon as vectors. The coordinates of raster element (i,j) are (lat(i),lon(j)). The default for gridOption is 'fullgrid', which returns lat and lon as 2-D arrays.

Examples

collapse all

Import elevation data [1] for an area around South Boulder Peak in Colorado as an array and a geographic postings reference object. Find the coordinates of each element in the array.

[Z,R] = readgeoraster('n39_w106_3arc_v2.dt1');
[lat,lon] = geographicGrid(R);

Create a map with latitude and longitude limits that match the limits of the data. Display the data using an appropriate colormap.

usamap(R.LatitudeLimits,R.LongitudeLimits)
surfm(lat,lon,Z)
demcmap(Z)

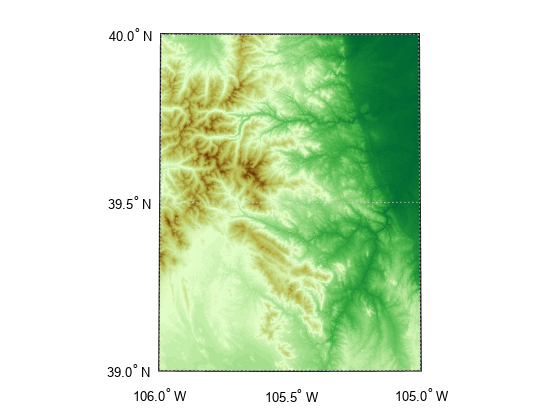
[1] The elevation data used in this example is courtesy of the U.S. Geological Survey.

Create a geographic cells reference object for a 3-by-4 raster with latitude values in the range [0, 30] degrees and longitude values in the range [-20, 20] degrees. Get the coordinates of the raster elements and return them as row vectors.

R = georefcells([0 30],[-20 20],[3 4]);
[lat,lon] = geographicGrid(R,'gridvectors')
lat = 1×3

     5    15    25

lon = 1×4

   -15    -5     5    15

If you do not specify the second argument as 'gridvectors', then the geographicGrid function returns 2-D arrays by default.

[latFull,lonFull] = geographicGrid(R)
latFull = 3×4

     5     5     5     5
    15    15    15    15
    25    25    25    25

lonFull = 3×4

   -15    -5     5    15
   -15    -5     5    15
   -15    -5     5    15

Input Arguments

collapse all

Spatial reference, specified as a GeographicCellsReference or GeographicPostingsReference object.

If R is a GeographicCellsReference object, then lat and lon are cell centers. If R is a GeographicPostingsReference object, then lat and lon are posting points.

Grid option, specified as one of these values:

  • 'fullgrid' — Return lat and lon as 2-D arrays, where each column of lat is identical and each row of lon is identical. This is the default behavior.

  • 'gridvectors' — Return lat and lon as row vectors. Use this option when you want to reduce memory usage and when 2-D arrays are unnecessary, such as when plotting large data sets with the surfm function.

This table shows the difference between 'fullgrid' and 'gridvectors'.

'fullgrid''gridvectors'
R = georefcells([0 30],[-20 20],[3 4]);
[lat,lon] = geographicGrid(R)
lat =

     5     5     5     5
    15    15    15    15
    25    25    25    25


lon =

   -15    -5     5    15
   -15    -5     5    15
   -15    -5     5    15
R = georefcells([0 30],[-20 20],[3 4]);
[lat,lon] = geographicGrid(R,'gridvectors')
lat =

     5    15    25


lon =

   -15    -5     5    15

Data Types: char | string

Output Arguments

collapse all

Latitudes, returned as a 2-D array or a row vector. By default, lat is a 2-D array. To return lat as a row vector, specify gridOption as 'gridvectors'.

By default, and when gridOption is 'fullgrid', the sizes of lat and lon each equal the RasterSize property of R. When gridOption is 'gridvectors', the lengths of lat and lon equal the first and second elements of the RasterSize property of R, respectively.

Longitudes, returned as a 2-D array or a row vector. By default, lon is a 2-D array. To return lon as a row vector, specify gridOption as 'gridvectors'.

By default, and when gridOption is 'fullgrid', the sizes of lat and lon each equal the RasterSize property of R. When gridOption is 'gridvectors', the lengths of lat and lon equal the first and second elements of the RasterSize property of R, respectively.

Version History

Introduced in R2021a