Create 3D Scenarios
R2026bThe 3D Scenarios add-on enables you to model, visualize, and simulate scenarios in a 3D geographic environment. The add-on supports applications such as communication network design, autonomous navigation, and mission planning.
A 3D scenario consists of a scene, actors, and analyses.
The scene represents the geographic environment, including terrain and buildings.
Actors represent physical objects within the scenario, such as vehicles, aircraft, and communication towers. Actors can be stationary or follow trajectories.
Analyses perform calculations on actors within the scenario. For example, a line-of-sight (LOS) analysis calculates whether an LOS path exists between actors.
This example shows how to:
Create a scenario with terrain and buildings.
Visualize the scenario in a 3D viewer.
Add stationary and moving actors.
Run a simulation that analyzes the visibility of the actors over time.
Update the scenario and rerun the simulation.
Before you begin, you must install the 3D Scenarios add-on. You can install the 3D Scenarios add-on by using the install3DScenarios function.
Create Scenario
Create a 3D scenario with terrain and buildings for a region in Manhattan.
Read buildings from an OpenStreetMap® file [1] and add them to the list of buildings available for use with 3D scenarios. When you add buildings using the addCustomBuildings function, you select a name for the buildings, such as "manhattan". Avoid overwriting buildings that already exist by using the NameExistsRule argument. The manhattan.osm file is included with the 3D Scenarios add-on, and you can download other OpenStreetMap files from https://www.openstreetmap.org.
buildingsLayer = readgeotable("manhattan.osm",Layer="buildings");
addCustomBuildings("manhattan",buildingsLayer,NameExistsRule="preserve")
Create a scenario with the custom buildings by using the scenario function.
scnro = scenario(Buildings="manhattan");Query the scene that defines the geographic environment for the scenario. The scene specifies the terrain and buildings. The scene also reports a reference frame, which indicates that the scenario is referenced to the WGS84 coordinate reference system.
scnro.Scene
ans =
  Scene with properties:

           Terrain: "gmted2010"
         Buildings: "manhattan"
    ReferenceFrame: [1×1 ReferenceFrame]
By default, the scene uses terrain data from the GMTED2010 model. To use custom terrain from a DTED file, first add the custom terrain by using the addCustomTerrain function. Then, specify the terrain using the Terrain name-value argument of the scenario function.
Visualize Scenario
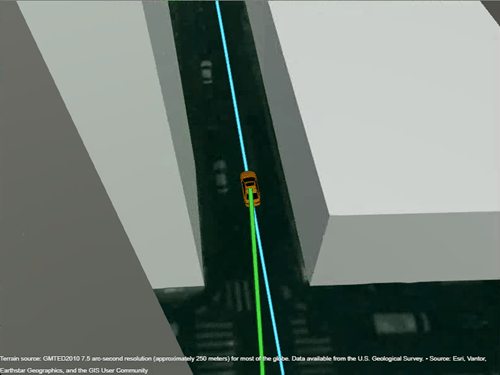
Visualize the scenario in a 3D globe viewer by using the viewer function. By default, the viewer automatically displays actors, trajectories, and analyses that you add to the scenario.
v = viewer(scnro);
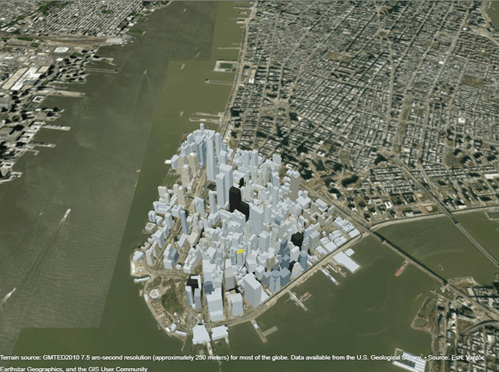
You can navigate the globe interactively or programmatically.
To interactively navigate, pan by left-clicking and dragging, zoom by using the scroll wheel, and rotate by pressing Ctrl, left-clicking, and dragging.
To programmatically navigate, use functions such as
zoomtoandfollow. Use thezoomtofunction to focus the camera on a specified actor, trajectory, or analysis. Use thefollowfunction to focus the camera on a specified actor and follow the actor during simulation.
Add Actors
Add stationary and mobile actors to the scenario.
You can create actors by using these functions:
car— Create a car actor, which includes a 3D model of a sedan that is used for visualization and analysis.aircraft— Create an aircraft actor, which includes a 3D model of a narrowbody aircraft that is used for visualization and analysis.actor— Create a generic point actor with no 3D model. Use point actors to represent other types of physical objects.
You can create trajectories for the actors by using these functions:
groundTrajectory— Create a ground trajectory that interpolates a path through 2D waypoints along the terrain.airTrajectory— Create an air trajectory that interpolates a path through 3D waypoints.
Add Tower
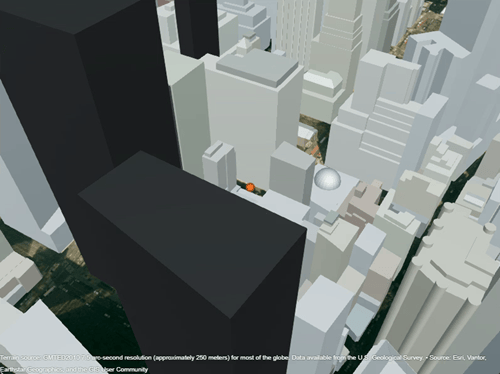
Model a stationary communication tower by placing a generic actor above the roof of a building.
Specify the latitude, longitude, and height of the actor by using the pointtable function. Indicate that the height is referenced to the scenario surface, which includes terrain and buildings, by using the HeightReference argument. Other height reference options include the terrain and the WGS84 ellipsoid. Then, add the actor to the scenario.
towerlat = 40.7085;
towerlon = -74.0098;
towerht = 25;
towerPos = pointtable(towerlat,towerlon,towerht,HeightReference="surface");
tower = actor(scnro,towerPos);
Zoom the viewer to the tower. The viewer represents the tower using a point.
zoomto(tower)
Add Car
Model a car that travels along a road by creating a car actor with a ground trajectory.
Specify waypoints for the trajectory. For this example, you can choose whether to programmatically or interactively specify the waypoints by using the selectionMode variable.
To programmatically select waypoints, specify latitude and longitude coordinates. The predefined waypoints follow a route through Manhattan.
To interactively select waypoints in the viewer, use the
pickpointsfunction. Select the waypoints by clicking the globe. When you are done selecting points, press Enter or Escape.
selectionMode ="programmatic"; if selectionMode == "programmatic" lat = [40.707744 40.707851 40.708009 40.708165 40.708320 40.708475 ... 40.708629 40.708774 40.708919 40.709064 40.709216 40.709368 ... 40.709520 40.709672 40.709824 40.709976 40.710129 40.710280 ... 40.710430 40.710579 40.710711 40.710841 40.710971 40.711101 ... 40.711231]; lon = [-74.010156 -74.010063 -74.009924 -74.009784 -74.009641 -74.009498 ... -74.009354 -74.009193 -74.009032 -74.008873 -74.008725 -74.008576 ... -74.008428 -74.008280 -74.008131 -74.007983 -74.007835 -74.007685 ... -74.007533 -74.007380 -74.007202 -74.007021 -74.006840 -74.006659 ... -74.006478]; else [lat,lon] = pickpoints(v); end
Create a ground trajectory from the waypoints by using the pointtable and groundTrajectory functions. Specify the ground speed of the car as 10 m/s.
waypts = pointtable(lat,lon);
traj = groundTrajectory(waypts,GroundSpeed=10);
Add a car actor with the ground trajectory to the scenario.
c = car(scnro,traj);
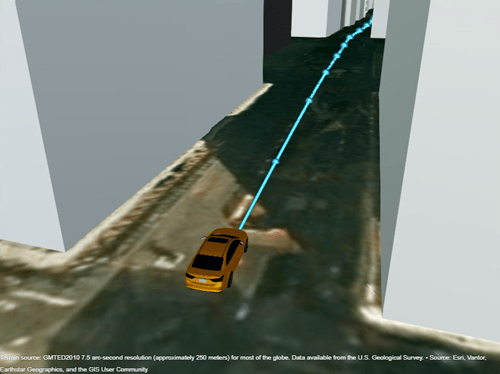
Zoom the viewer to the car and then interactively adjust the camera. The viewer represents the car using a 3D model of a sedan. By default, the trajectory displays the waypoints using markers.
zoomto(c)
Add Analyses
Add analyses to the scenario. You can create analyses by using these functions:
losAnalysis— Create a LOS analysis, which determines whether a direct, unobstructed path exists between actors.rayTraceAnalysis— Create a ray trace analysis, which calculates geometric paths between actors.
Both analyses account for the actors, terrain, and buildings in the scene.
Add Line-of-Sight Analysis
Create a line-of-sight analysis from the tower to the car.
losA = losAnalysis(tower,c);
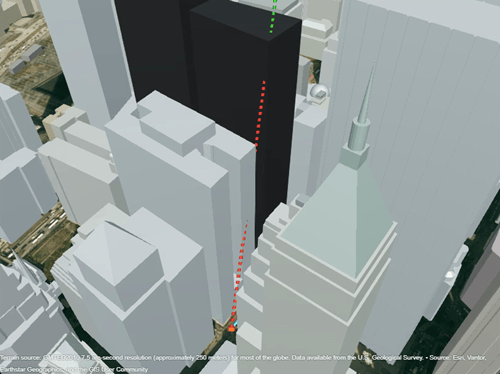
Zoom the viewer to the LOS analysis. The dashed line indicates that the car is not visible from the tower. The color of the line changes from green to red at the obstruction point.
zoomto(losA)
Customize Visuals
Customize how entities such as actors, trajectories, and analyses appear in the viewer. Get the visual for an entity by querying its Visual property. If you have more than one viewer, get the visual from a specific viewer by using the getvisual function. For examples of supported customizations, see the ActorVisual, WaypointTrajectoryVisual, and LOSVisual reference pages.
You can customize visuals at any time, including during and after simulation.
Customize Trajectory Visualization
Get the visual associated with the car trajectory. The trajectory is stored in the Behavior property of the actor object. Then, reduce visual clutter by hiding the waypoint markers.
trajVis = c.Behavior.Visual;
trajVis.ShowWaypoints = false;
Customize Analysis Visualization
Get the visual associated with the LOS analysis. Then, update the visual to use a thicker line and to use magenta for the obstructed color.
losVis = losA.Visual;
losVis.LineWidth = 7;
losVis.ObstructedColor = "magenta";
Simulate Scenario
Run the simulation by using the advance function in a loop. The advance function moves the simulation forward by one time step, which includes moving the actors along their trajectories, recalculating the analyses, and updating the visuals. By default, the simulation ends when all actors reach the end of their trajectories.
Prepare Simulation
Prepare to run a simulation that, at each time step, calculates the visibility and range from the tower to the car.
Initialize variables that store the LOS statuses, the ranges from the tower to the car, and the simulation times.
Create a body frame for the tower by using the
bodyframefunction. A body frame is a local Cartesian coordinate system that is centered on an actor. Use the frame to query the position of the car relative to the tower, and then to calculate the range.Specify a camera view that follows the car. The offset positions the camera 20 meters south, 20 meters west, and 40 meters above the car, using east-north-up coordinates in meters.
loshist = logical.empty;
rangehist = [];
simtimes = duration.empty;

towerFrame = bodyframe(tower);

follow(c,Offset=[-20 -20 40]);
Run Simulation
Run the simulation. At each time step:
Get the LOS status using the
hasLOSfunction and record the result.Calculate the range from the tower to the car and record the result. Get the pose of the car relative to the tower by using the
posefunction. The pose stores the position of the car in Cartesian coordinates. Use the position to calculate the range.Query the simulation time and record the result.
while advance(scnro)
    % Get LOS status
    vis = hasLOS(losA);
    loshist = [loshist; vis]; %#ok<AGROW>

    % Calculate range
    p = pose(c,ReferenceFrame=towerFrame);
    rnge = norm(p.Position);
    rangehist = [rangehist; rnge]; %#ok<AGROW>

    % Record simulation time
    simtime = scnro.SimulationTime;
    simtimes = [simtimes; simtime]; %#ok<AGROW>
end
Analyze Results
After the simulation, understand how visibility changes over time by analyzing the recorded data.
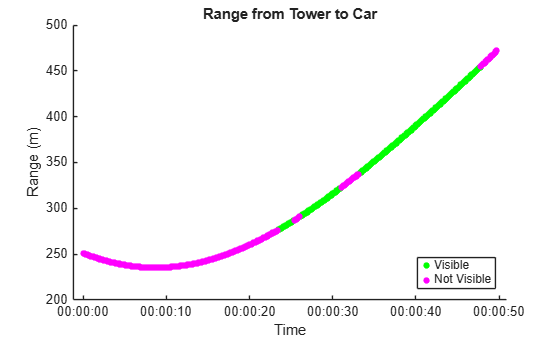
Calculate the percentage of simulation steps where the car is visible from the tower.
numSamples = numel(loshist);
visPercentage = 100 * sum(loshist) / numSamples;
disp("Car is visible for " + visPercentage + "% of the simulation.")
Car is visible for 42.9719% of the simulation.
Plot the range from the tower to the car over time. Use green when the car is visible and magenta when the car is not visible.
figure
hold on
plot(simtimes(loshist),rangehist(loshist),"o",MarkerSize=4,Color="green",MarkerFaceColor="green")
plot(simtimes(~loshist),rangehist(~loshist),"o",MarkerSize=4,Color="magenta",MarkerFaceColor="magenta")
Add axis labels, a title, and a legend.
xlabel("Time")
ylabel("Range (m)")
title("Range from Tower to Car")
legend(["Visible","Not Visible"],Location="southeast")
Iterate on Scenario
You can iterate on a scenario by restarting the simulation, making changes, and running the simulation again. For this example, iterate on the scenario by changing the height of the tower and comparing the visibility results.
After a simulation starts, changing the actor positions, trajectories, and analysis properties is not supported. To make changes, reset the simulation to the beginning by using the restart function.
Restart the scenario. Then, change the height of the tower from 25 meters to 40 meters above the building surface.
restart(scnro)

towerht2 = 40;
towerPos2 = pointtable(towerlat,towerlon,towerht2,HeightReference="surface");
position(tower,towerPos2);
Run the simulation again. This time, record only the LOS status at each time step.
loshist2 = logical.empty;
while advance(scnro)
    loshist2 = [loshist2; hasLOS(losA)]; %#ok<AGROW>
end
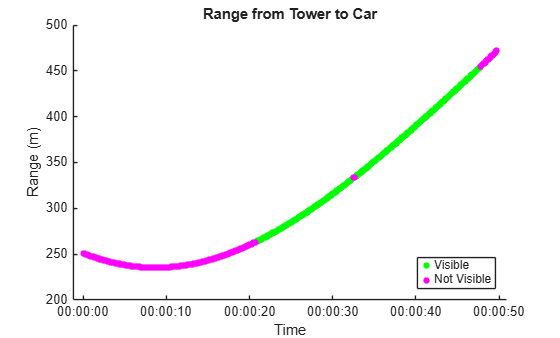
Calculate the percentage of simulation steps where the car is visible from the tower. Increasing the tower height improves the visibility of the car from about 43% to about 54% of the simulation.
visPercentage2 = 100 * sum(loshist2) / numel(loshist2);
disp("Car is visible for " + visPercentage2 + "% of the simulation with a taller tower.")
Car is visible for 53.8153% of the simulation with a taller tower.
Plot the range from the tower to the car over time. The plot shows additional times when the car is visible from the tower.
figure
hold on
plot(simtimes(loshist2),rangehist(loshist2),"o",MarkerSize=4,Color="green",MarkerFaceColor="green")
plot(simtimes(~loshist2),rangehist(~loshist2),"o",MarkerSize=4,Color="magenta",MarkerFaceColor="magenta")

xlabel("Time")
ylabel("Range (m)")
title("Range from Tower to Car")
legend(["Visible","Not Visible"],Location="southeast")
References
[1] You can download OpenStreetMap files from https://www.openstreetmap.org, which provides access to crowd-sourced map data all over the world. The data is licensed under the Open Data Commons Open Database License (ODbL), https://opendatacommons.org/licenses/odbl/.
See Also
scenarioviewerpointtableadvanceactor

