Point Properties
Point properties control the appearance and behavior of a
Point object. By changing property values, you can modify certain aspects
of the point. Use dot notation to query and set properties.
shape = geopointshape(1:10,1:10);
p = geoplot(shape);
c = p.Marker;
p.Marker = "*";
Markers
Marker symbol, specified as one of the options listed in this table:
| Marker | Description | Resulting Marker |
|---|---|---|
"o" | Circle |
|
"+" | Plus sign |
|
"*" | Asterisk |
|
"." | Point |
|
"x" | Cross |
|
"_" | Horizontal line |
|
"|" | Vertical line |
|
"square" | Square |
|
"diamond" | Diamond |
|
"^" | Upward-pointing triangle |
|
"v" | Downward-pointing triangle |
|
">" | Right-pointing triangle |
|
"<" | Left-pointing triangle |
|
"pentagram" | Pentagram |
|
"hexagram" | Hexagram |
|
"none" | No markers | Not applicable |
Marker outline color, specified as 'flat', an RGB triplet, a
hexadecimal color code, a color name, or a short name. The 'flat'
option uses colors from the ColorData property. When the
geoplot function sets the ColorData
property, MATLAB® updates this property to 'flat'.
For a custom color, specify an RGB triplet or a hexadecimal color code.
An RGB triplet is a three-element row vector whose elements specify the intensities of the red, green, and blue components of the color. The intensities must be in the range
[0,1], for example,[0.4 0.6 0.7].A hexadecimal color code is a string scalar or character vector that starts with a hash symbol (
#) followed by three or six hexadecimal digits, which can range from0toF. The values are not case sensitive. Therefore, the color codes"#FF8800","#ff8800","#F80", and"#f80"are equivalent.
Alternatively, you can specify some common colors by name. This table lists the named color options, the equivalent RGB triplets, and the hexadecimal color codes.
| Color Name | Short Name | RGB Triplet | Hexadecimal Color Code | Appearance |
|---|---|---|---|---|
"red" | "r" | [1 0 0] | "#FF0000" |
|
"green" | "g" | [0 1 0] | "#00FF00" |
|
"blue" | "b" | [0 0 1] | "#0000FF" |
|
"cyan"
| "c" | [0 1 1] | "#00FFFF" |
|
"magenta" | "m" | [1 0 1] | "#FF00FF" |
|
"yellow" | "y" | [1 1 0] | "#FFFF00" |
|
"black" | "k" | [0 0 0] | "#000000" |
|
"white" | "w" | [1 1 1] | "#FFFFFF" |
|
"none" | Not applicable | Not applicable | Not applicable | No color |
This table lists the default color palettes for plots in the light and dark themes.
| Palette | Palette Colors |
|---|---|
Before R2025a: Most plots use these colors by default. |
|
|
|
You can get the RGB triplets and hexadecimal color codes for these palettes using the orderedcolors and rgb2hex functions. For example, get the RGB triplets for the "gem" palette and convert them to hexadecimal color codes.
RGB = orderedcolors("gem");
H = rgb2hex(RGB);
Before R2023b: Get the RGB triplets using RGB =
get(groot,"FactoryAxesColorOrder").
Before R2024a: Get the hexadecimal color codes using H =
compose("#%02X%02X%02X",round(RGB*255)).
Example: [0.5 0.5 0.5]
Example: 'blue'
Example: '#D2F9A7'
Marker fill color, specified as 'flat', an RGB triplet, a
hexadecimal color code, a color name, or a short name. The 'flat'
option use colors from the ColorData property.
For a custom color, specify an RGB triplet or a hexadecimal color code.
An RGB triplet is a three-element row vector whose elements specify the intensities of the red, green, and blue components of the color. The intensities must be in the range
[0,1], for example,[0.4 0.6 0.7].A hexadecimal color code is a string scalar or character vector that starts with a hash symbol (
#) followed by three or six hexadecimal digits, which can range from0toF. The values are not case sensitive. Therefore, the color codes"#FF8800","#ff8800","#F80", and"#f80"are equivalent.
Alternatively, you can specify some common colors by name. This table lists the named color options, the equivalent RGB triplets, and the hexadecimal color codes.
| Color Name | Short Name | RGB Triplet | Hexadecimal Color Code | Appearance |
|---|---|---|---|---|
"red" | "r" | [1 0 0] | "#FF0000" |
|
"green" | "g" | [0 1 0] | "#00FF00" |
|
"blue" | "b" | [0 0 1] | "#0000FF" |
|
"cyan"
| "c" | [0 1 1] | "#00FFFF" |
|
"magenta" | "m" | [1 0 1] | "#FF00FF" |
|
"yellow" | "y" | [1 1 0] | "#FFFF00" |
|
"black" | "k" | [0 0 0] | "#000000" |
|
"white" | "w" | [1 1 1] | "#FFFFFF" |
|
"none" | Not applicable | Not applicable | Not applicable | No color |
This table lists the default color palettes for plots in the light and dark themes.
| Palette | Palette Colors |
|---|---|
Before R2025a: Most plots use these colors by default. |
|
|
|
You can get the RGB triplets and hexadecimal color codes for these palettes using the orderedcolors and rgb2hex functions. For example, get the RGB triplets for the "gem" palette and convert them to hexadecimal color codes.
RGB = orderedcolors("gem");
H = rgb2hex(RGB);
Before R2023b: Get the RGB triplets using RGB =
get(groot,"FactoryAxesColorOrder").
Before R2024a: Get the hexadecimal color codes using H =
compose("#%02X%02X%02X",round(RGB*255)).
Example: [0.3 0.2 0.1]
Example: 'green'
Example: '#D2F9A7'
Marker outline transparency, specified as a scalar in the range
[0,1]. A value of 1 is opaque and
0 is completely transparent. Values between 0
and 1 are semitransparent.
Marker fill transparency, specified as a scalar in the range
[0,1]. A value of 1 is opaque and
0 is completely transparent. Values between 0
and 1 are semitransparent.
Color Data
Shape Data
Point shapes, specified as a geopointshape or
mappointshape object or as a vector of geopointshape
or mappointshape objects. For mappointshape objects,
the value of the ProjectedCRS property must not be empty.
When you pass shape objects or a geospatial table to the
geoplot function, the geoplot function sets
the value of ShapeData.
Control how the ShapeData property is set, specified as one of these values:
'auto'— MATLAB automatically updates theShapeDataproperty based on theSourceTableandShapeVariableproperties. When you pass a geospatial table to thegeoplotfunction, MATLAB sets this property to'auto'.'manual'— You manually control the value of theShapeDataproperty. When you set theShapeDataproperty or pass shape objects to thegeoplotfunction, MATLAB sets this property to'manual'.
Since R2026a
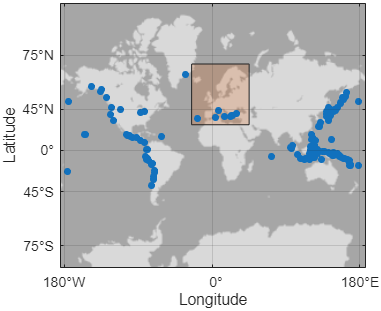
Include the data range of the points in the automatic calculation of the axes
limits, specified as "on", "off", logical
1 (true), or 0
(false). The value is stored as an on/off logical value of type
matlab.lang.OnOffSwitchState.
By default, the axes limits automatically change to include the data range of each
successive plot you create in the axes. Changing this property enables you to focus on a
subset of data. To exclude the data range of the point object from the automatic
calculation of axes limits, set the AffectAutoLimits property of
the object to "off".
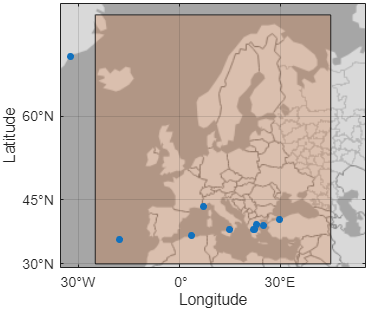
Point with AffectAutoLimits set to
"on" | Point with AffectAutoLimits set to
"off" |
|---|---|
|
|
|