Main Content

mapoutline

Compute outline of georeferenced image or data grid

Syntax

[x,y] = mapoutline(R,height,width)
[x,y] = mapoutline(R, sizea)
[x,y] = mapoutline(...,'close')
[lon,lat] = mapoutline(R,...)
outline = mapoutline(...)

Description

[x,y] = mapoutline(R,height,width) computes the outline of a georeferenced image or regular gridded data set in map coordinates. R is a MapCellsReference or MapPostingsReference object. height and width are the image dimensions. x and y are 4-by-1 column vectors containing the map coordinates of the outer corners of the corner pixels, in the following order:

(1,1), (height,1), (height, width), (1, width).

[x,y] = mapoutline(R, sizea) accepts sizea = [height, width, ...] instead of height and width.

[x,y] = mapoutline(...,'close') returns x and y as 5-by-1 vectors, appending the coordinates of the first of the four corners to the end.

[lon,lat] = mapoutline(R,...), where R georeferences pixels to longitude and latitude rather than map coordinates, returns the outline in geographic coordinates. Longitude must precede latitude in the output argument list.

outline = mapoutline(...) returns the corner coordinates in a 4-by-2 or 5-by-2 array.

Examples

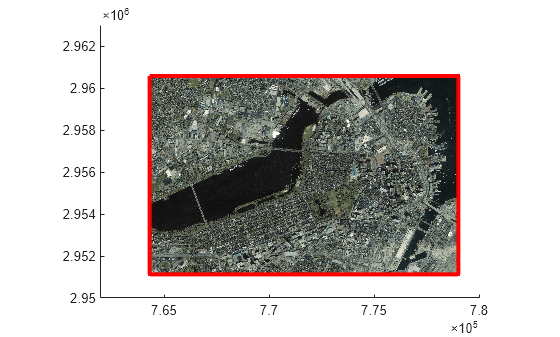
Draw a red outline delineating the Boston GeoTIFF image, which is referenced to the Massachusetts Mainland State Plane coordinate system with units of survey feet.

figure
info = georasterinfo('boston.tif');
R = info.RasterReference;
[x,y] = mapoutline(R,R.RasterSize,'close');

hold on
plot(x,y,'r')
xlabel('MA Mainland State Plane easting, survey feet')
ylabel('MA Mainland State Plane northing, survey feet')
Draw a black outline delineating a TIFF image of Concord, Massachusetts, while lies roughly 25 km north west of Boston. Convert world file units to survey feet from meters to be consistent with the Boston image.
info  = imfinfo('concord_ortho_w.tif');
R = worldfileread('concord_ortho_w.tfw','planar', ...
        [info.Height info.Width]);
[x,y] = mapoutline(R, info.Height, info.Width, 'close');
x = x * unitsratio('sf','meter');
y = y * unitsratio('sf','meter');
plot(x,y,'k')

A Cartesian plot showing a black rectangle in the upper-left corner and a red rectangle in the lower-right corner. The x-axis and y-axis show eastings and northings, respectively, in survey feet.

Version History

Introduced before R2006a

expand all