Chart Class with Variable Number of Lines
This example shows how to define a class of charts that can display any number of lines based on the size of the user's data. The chart displays as many lines as there are columns in the YData matrix. For each line, the chart calculates the local extrema and indicates their locations with circular markers. The following code demonstrates how to:
Define two properties called
PlotLineArrayandExtremaArraythat store the objects for the lines and the markers, respectively.Implement an
updatemethod that replaces the contents of thePlotLineArrayandExtremaArrayproperties with the new objects. Because this method executes all the plotting and configuration commands, thesetupmethod is empty. This is a simple way to create any number of lines. To learn how to create this chart more efficiently, by reusing existing line objects, see Optimized Chart Class for Displaying Variable Number of Lines.
To define the class, copy this code into the editor and save it with the name LocalExtremaChart.m in a writable folder.
classdef LocalExtremaChart < matlab.graphics.chartcontainer.ChartContainer
    % c = LocalExtremaChart('XData',X,'YData',Y,Name,Value,...)
    % plots one line with markers at local extrema for every column of matrix Y.
    % You can also specify the additonal name-value arguments, 'MarkerColor'
    % and 'MarkerSize'.

    properties
        XData (1,:) double = NaN
        YData (:,:) double = NaN
        MarkerColor {validatecolor} = [1 0 0]
        MarkerSize (1,1) double = 5
    end
    properties(Access = private,Transient,NonCopyable)
        PlotLineArray (:,1) matlab.graphics.chart.primitive.Line
        ExtremaArray (:,1) matlab.graphics.chart.primitive.Line
    end

    methods(Access = protected)
        function setup(~)
        end
        function update(obj)
            % get the axes
            ax = getAxes(obj);

            % Plot Lines and the local extrema
            obj.PlotLineArray = plot(ax,obj.XData,obj.YData);
            hold(ax,'on')

            % Replicate x-coordinate vectors to match size of YData
            newx = repmat(obj.XData(:),1,size(obj.YData,2));

            % Find local minima and maxima and plot markers
            tfmin = islocalmin(obj.YData,1);
            tfmax = islocalmax(obj.YData,1);
            obj.ExtremaArray = plot(ax,newx(tfmin),obj.YData(tfmin),'o',...
                newx(tfmax),obj.YData(tfmax),'o',...
                'MarkerEdgeColor','none',...
                'MarkerFaceColor',obj.MarkerColor,...
                'MarkerSize',obj.MarkerSize);
            hold(ax,'off')
        end
    end
end
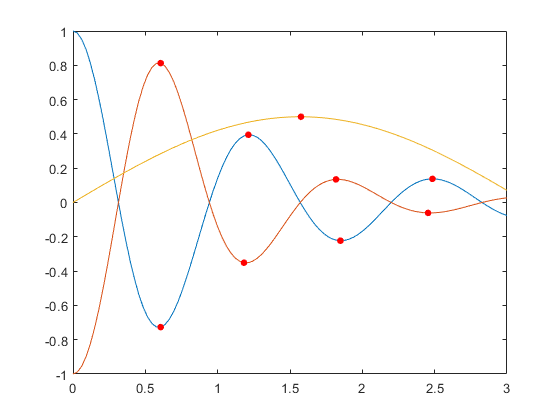
After saving the class file, you can create an instance of the chart. For example:
x = linspace(0,3);
y1 = cos(5*x)./(1+x.^2);
y2 = -cos(5*x)./(1+x.^3);
y3 = sin(x)./2;
y = [y1' y2' y3'];
c = LocalExtremaChart('XData',x,'YData',y);
Change the marker size to 8.
c.MarkerSize = 8;
