Creazione di grafici bidimensionali comuni
Questo esempio mostra come creare una serie di grafici bidimensionali in MATLAB®.
Grafici lineari
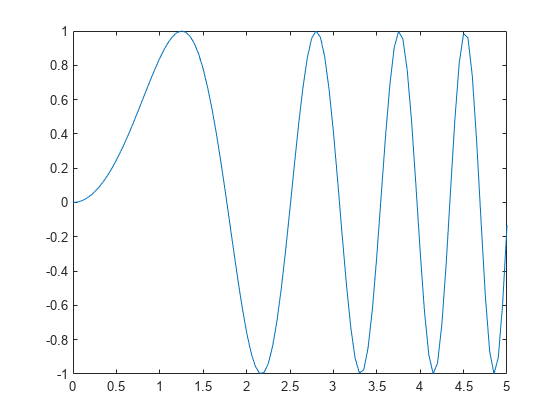
La funzione plot crea grafici lineari semplici dei valori x e y.
x = 0:0.05:5;
y = sin(x.^2);
figure
plot(x,y)
I grafici lineari possono visualizzare più insieme di dati x e y.
y1 = sin(x.^2);
y2 = cos(x.^2);
plot(x,y1,x,y2)

Grafici a barre
La funzione bar crea grafici a barre verticali. La funzione barh crea grafici a barre orizzontali.
x = -2.9:0.2:2.9;
y = exp(-x.*x);
bar(x,y)

Grafici a scalini
La funzione stairs crea un grafico a gradini. È possibile creare un grafico a gradini dei soli valori Y oppure un grafico a gradini dei valori x e y.
x = 0:0.25:10;
y = sin(x);
stairs(x,y)

Grafici con barre di errore
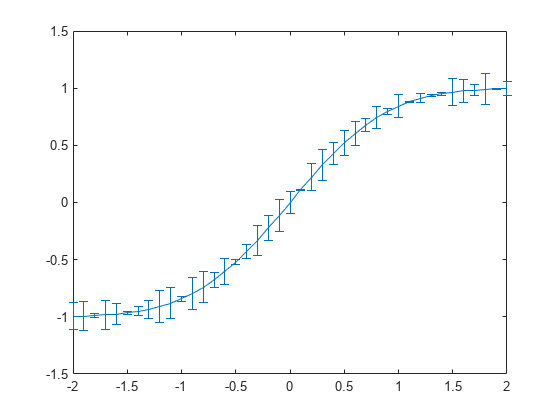
La funzione errorbar traccia un grafico lineare dei valori x e y e sovrappone una barra di errore verticale su ciascuna osservazione. Per specificare la dimensione della barra di errore, passare un ulteriore argomento di input alla funzione errorbar.
x = -2:0.1:2;
y = erf(x);
eb = rand(size(x))/7;
errorbar(x,y,eb)
Grafici polari
La funzione polarplot traccia un grafico polare dei valori angolari in theta (in radianti) rispetto ai valori del raggio in rho.
theta = 0:0.01:2*pi;
rho = abs(sin(2*theta).*cos(2*theta));
polarplot(theta,rho)

Grafici a stelo
La funzione stem traccia un marcatore per ciascun valore x e y con una linea verticale collegata a una baseline comune.
x = 0:0.1:4;
y = sin(x.^2).*exp(-x);
stem(x,y)

Grafici a dispersione
La funzione scatter traccia un grafico a dispersione dei valori x e y.
load patients Height Weight Systolic
scatter(Height,Weight)
xlabel('Height')
ylabel('Weight')

Utilizzare gli argomenti opzionali della funzione scatter per specificare la dimensione e il colore del marcatore. Utilizzare la funzione colorbar per visualizzare la scala dei colori sugli assi attuali.
scatter(Height,Weight,20,Systolic)
xlabel('Height')
ylabel('Weight')
colorbar
