Evidenziazione di livelli di contorno specifici
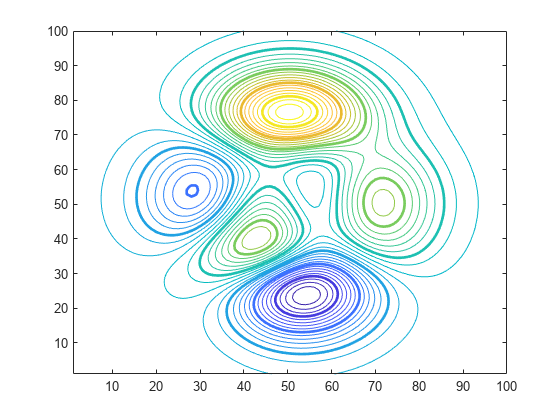
Questo esempio mostra come evidenziare i contorni a livelli particolari.
Definire Z come la matrice restituita dalla funzione peaks.
Z = peaks(100);
Arrotondare i valori minimi e massimi dei dati in Z e memorizzare tali valori rispettivamente in zmin e zmax. Definire zlevs come 40 valori compresi tra zmin e zmax.
zmin = floor(min(Z(:)));
zmax = ceil(max(Z(:)));
zinc = (zmax - zmin) / 40;
zlevs = zmin:zinc:zmax;
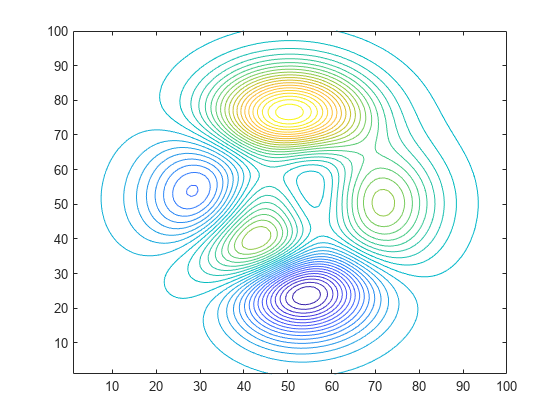
Tracciare le linee del contorno.
figure
contour(Z,zlevs)

Definire zindex come un vettore di valori interi compresi tra zmin e zmax indicizzati per 2.
zindex = zmin:2:zmax;
Conservare il grafico del contorno precedente. Creare un secondo grafico del contorno e utilizzare zindex per evidenziare le linee del contorno ad ogni altro valore intero. Impostare la larghezza della linea su 2.
hold on
contour(Z,zindex,'LineWidth',2)
hold off
