Save Figure to Reopen in MATLAB Later
This example shows how to save a figure so that you can reopen it in MATLAB® later.
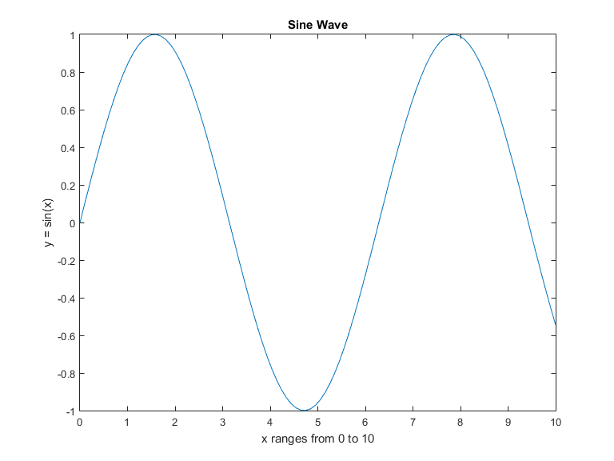
Create a plot to save. Add a title and axis labels.
x = linspace(0,10);
y = sin(x);
plot(x,y)
title('Sine Wave')
xlabel('x ranges from 0 to 10')
ylabel('y = sin(x)')
Save the figure to a FIG file using the savefig function. The FIG
file stores the information required to recreate the figure.
savefig('SineWave.fig')
Close the figure, then reopen the saved figure using the openfig
function.
close(gcf)
openfig('SineWave.fig')
openfig creates a new figure, a new axes, and a new line object
using the same data as the original objects. Most of the property values of the new
objects are the same as the original objects. However, any current default values apply
to the new figure. You can interact with the figure. For example, you can pan, zoom, and
rotate the axes.