Explore Basic Statistics on 2-D Plot
This example shows how to interactively explore and summarize plotted data using the Data Statistics tool. Using this tool, you can inspect and visualize basic statistics for a data series on the plot and save statistics to the MATLAB workspace for further analysis without writing code for each statistic.
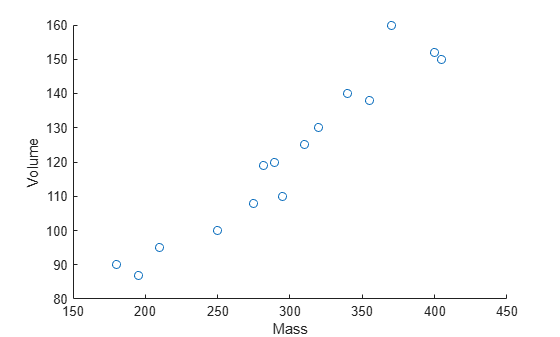
In this example, you analyze sample data consisting of the mass (g) and volume (cubic cm) measurements of 15 rocks.
Mass = [250 320 180 405 289 340 210 370 295 310 282 400 195 355 275]';
Volume = [100 130 90 150 120 140 95 160 110 125 119 152 87 138 108]';
T = table(Mass,Volume);
Visualize Data
Visualize the mass and volume data for each rock using a scatter plot.
scatter(T,"Mass","Volume")
Display Statistics on Plot
To use the Data Statistics tool, on the Tools tab of the figure, click Data Statistics. The Data Statistics tool displays descriptive statistics for the mass and volume measurements. To display specific statistics on the plot, select the check box for each statistic that you want to show.
For example, to display the mean mass and volume, select the mean check box in the X and Y columns. This action creates a vertical line and a horizontal line on the plot at the mean mass and volume and also automatically adds a legend.
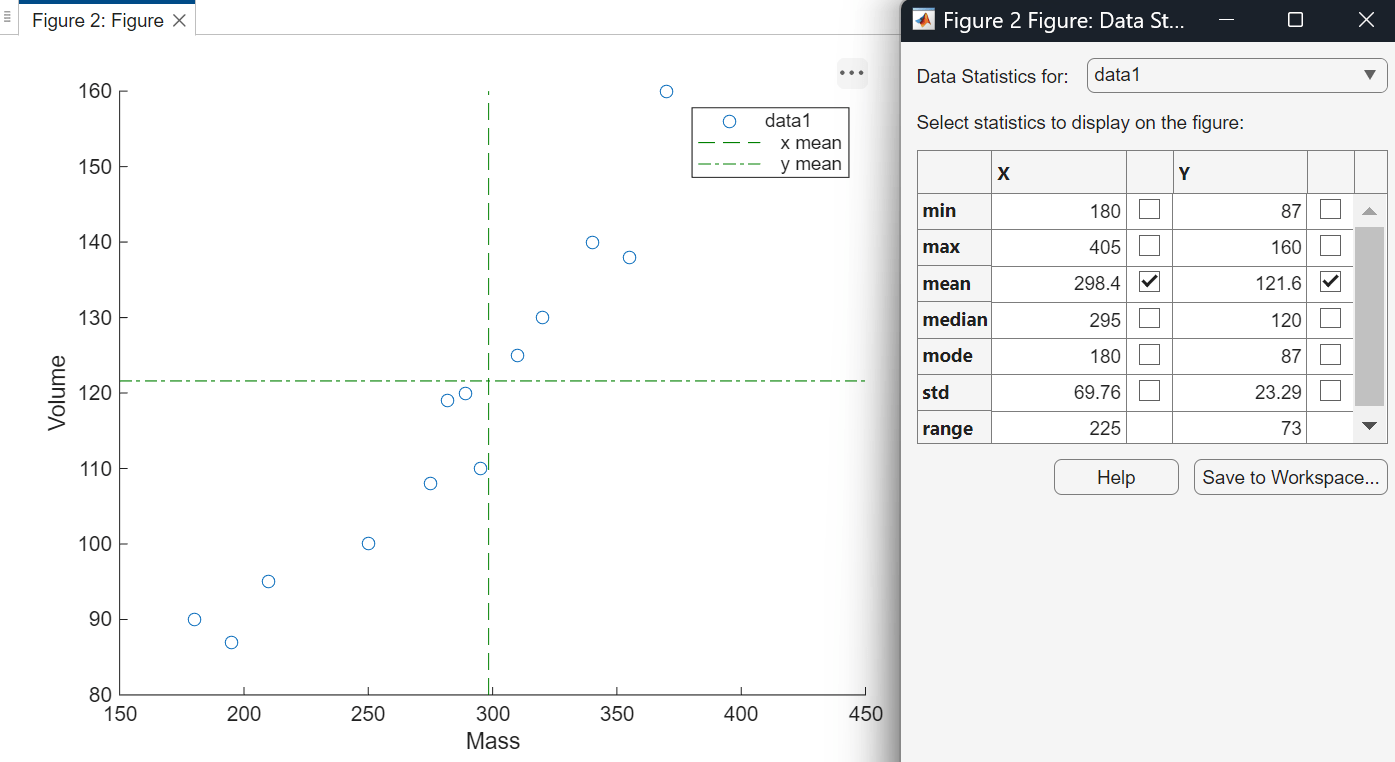
If your plot contains multiple data series, in the Data Statistics for list, select the series for which you want to compute statistics. Selecting a different data series clears the statistics for the previously selected data series from the plot.
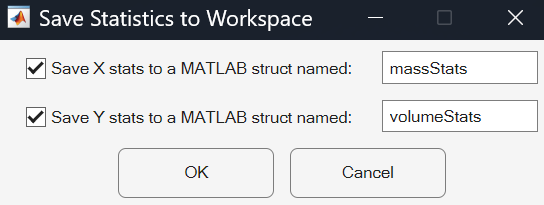
Save Statistics to Workspace
To save all of the statistics for further analysis, click Save to Workspace. The Data Statistics tool saves the statistics in scalar structures in the MATLAB workspace. You can specify a name for each structure.
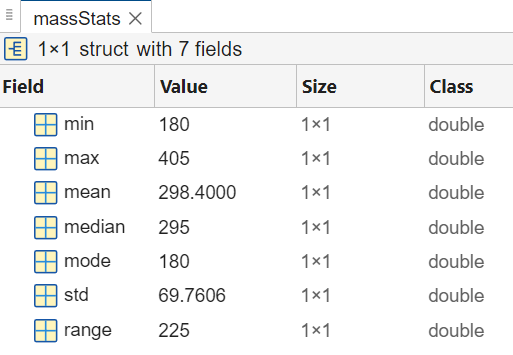
You can view the contents of each structure in the Variables editor.
openvar massStats
openvar volumeStats
You can access the statistics in the structure by using dot notation. For example, access the standard deviation of the mass measurements and then compute the variance.
massVar = massStats.std .^ 2;