3-D Voronoi Diagram
Compute the Voronoi diagram for a set of 3-D points, and plot a single region associated with one point.
Create a sample of 25 points in 3-D.
rng("default")
X = -3 + 6.*rand([25 3]);
Create the Delaunay triangulation for the set of points.
dt = delaunayTriangulation(X);
Compute the topology of the Voronoi diagram.
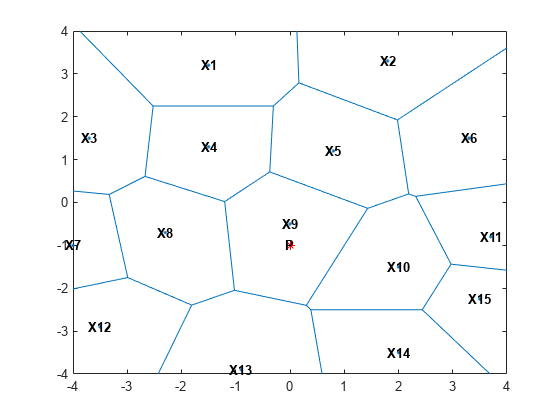
[V,R] = voronoiDiagram(dt);
In 3-D a Voronoi region is a convex polyhedron. To plot a single region of a Voronoi diagram, first choose a point. For example, find the point closest to the origin.
tid = nearestNeighbor(dt,0,0,0);
XR10 = V(R{tid},:);
Compute the convex hull of this point by using the convhull function.
K = convhull(XR10);
Use the resulting matrix to plot the Voronoi region associated with this point.
trisurf(K,XR10(:,1),XR10(:,2),XR10(:,3), ...
    FaceColor=[0.7 0.9 0.9],FaceAlpha=0.8)
title("3-D Voronoi Region")
Alternatively, you can use the voronoin function to compute the topology of the Voronoi diagram.
[V,R] = voronoin(X);