comet
2-D comet plot
Description
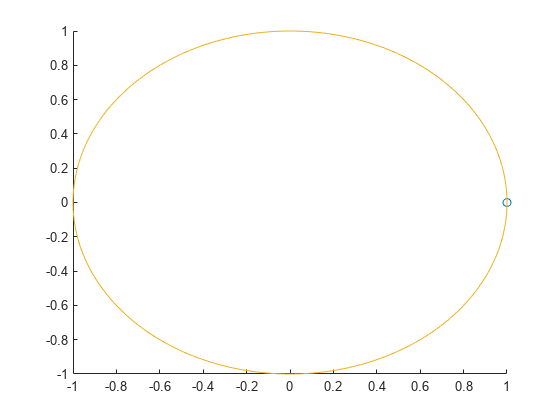
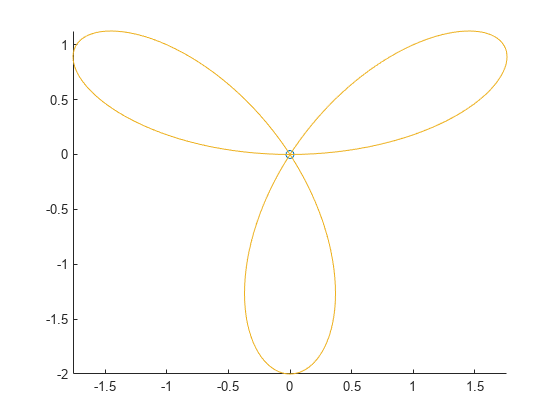
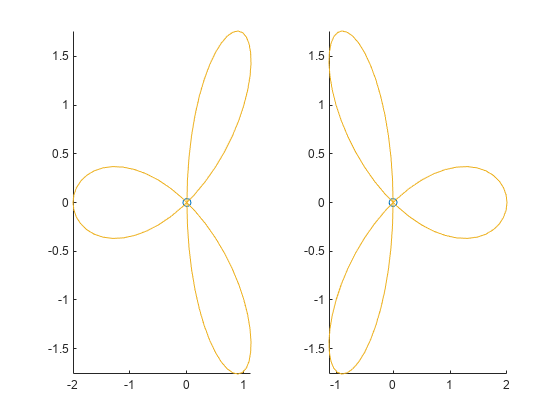
comet( displays a comet plot of the data
specified in y)y versus the index of each value. A
comet is an animation of a marker (head) and a line (tail) tracing
a growing line over the data points. The tail is a solid line that traces the entire
function.
Examples
Input Arguments
Limitations
Comet plots do not support data tips.
Extended Capabilities
Version History
Introduced before R2006a


