subtitle
Description
subtitle(___,
sets
properties on the text object using one or more name-value pair arguments. Specify the
properties after all other input arguments. For a list of properties, see Text Properties.Name,Value
)
subtitle(
specifies the
target object for the subtitle. The target object can be any type of axes, a tiled chart
layout, or an array of objects. Specify the target object before all other input
arguments.target
,___)
t = subtitle(___)
returns the text object for the
subtitle. Use t
to set properties on the object after creating the
subtitle. For a list of properties, see Text Properties.
Examples
Add Subtitle
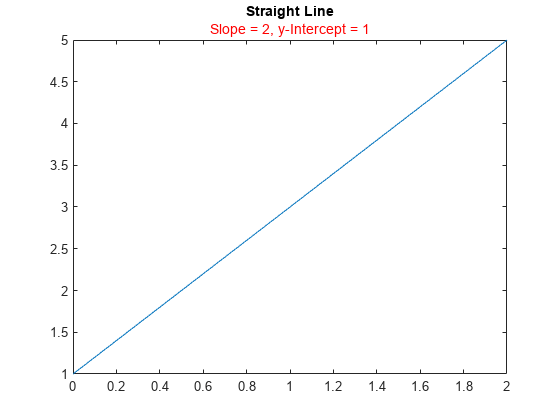
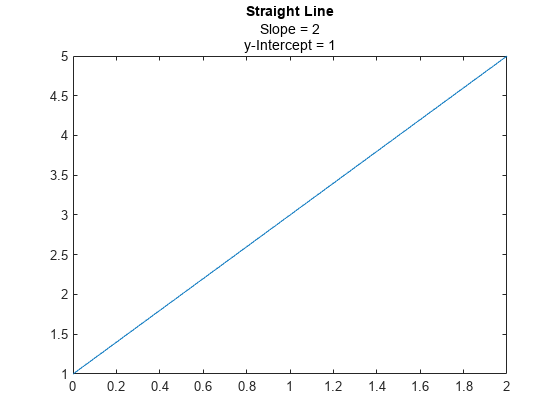
Create a plot. Add a title with the title
function. Then add a subtitle with the subtitle
function.
plot([0 2],[1 5]) title('Straight Line') subtitle('Slope = 2, y-Intercept = 1')
Include Variable in Subtitle
Create a plot, and add a title to the plot. Define slopevalue
and yintercept
as numeric variables. Define txt
as a combination of literal text and the values of slopevalue
and yintercept
converted to character vectors. Then, pass txt
to the subtitle
function to display the subtitle.
plot([0 2],[1 5]) title('Straight Line') slopevalue = 4; yintercept = 1; txt = ['Slope = ' int2str(slopevalue) ', y-Intercept = ' int2str(yintercept)]; subtitle(txt)
Change the Subtitle Color
Create a plot. Add a title with the title
function. Then, call the subtitle
function, and specify the color using the 'Color'
name-value pair argument. The color can be a color name, such as 'red'
, or you can specify a custom color using an RGB triplet or hexadecimal color code. In this case, specify 'red'
.
plot([0 2],[1 5]) title('Straight Line') subtitle('Slope = 2, y-Intercept = 1','Color','red')
Alternatively, call the subtitle
function with an output argument to return the text object. Then set the color on the text object. In this case, specify the hexadecimal color code '#DD5500'
.
txt = subtitle('Plot of y = 2x + 1'); txt.Color = '#DD5500';
Create Multicolored Subtitle Using TeX Markup
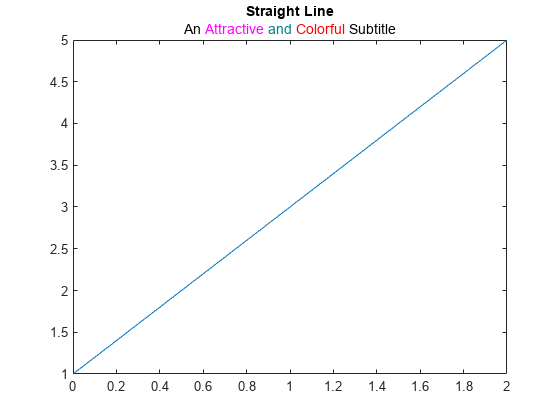
Create a plot, and add a title with the title
function. Create a character vector containing TeX markup with custom colors for different words in the subtitle. Then pass the character vector to the subtitle
function.
plot([0 2],[1 5]) title('Straight Line') txt = ['An {\color{magenta}Attractive '... '\color[rgb]{0 .5 .5}and \color{red}Colorful} Subtitle']; subtitle(txt)
Include Greek Symbols
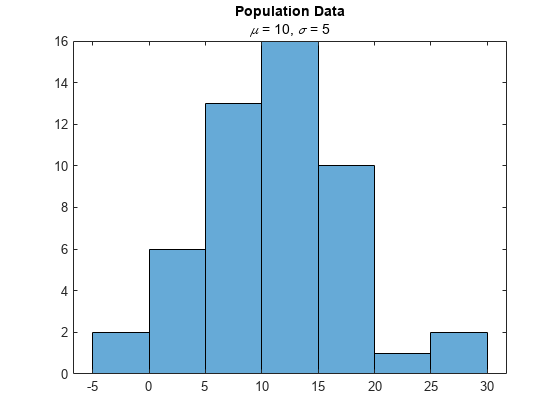
Create a histogram, and add a title with the title
function. Create a character vector containing TeX markup with Greek symbols. Then pass the character vector to the subtitle
function.
histogram(5*randn(1,50)+10) title('Population Data') txt = '{\it\mu} = 10, {\it\sigma} = 5'; subtitle(txt)
Include Superscripts and Subscripts
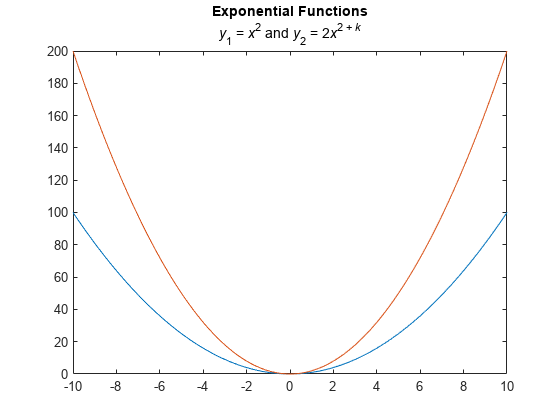
Create a histogram, and add a title with the title
function. Create a character vector containing TeX markup that displays subscripts and superscripts. Then pass the character vector to the subtitle
function.
x = -10:0.1:10; y1 = x.^2; y2 = 2*x.^2; plot(x,y1,x,y2); title('Exponential Functions') txt = 'y_1 = x^2 and y_2 = 2x^{2 + k}'; subtitle(txt)
To display an italic font for the variables, add the \it
modifier.
txt = '{\ity}_1 = {\itx}^2 and {\ity}_2 = 2{\itx}^{2 + \itk}';
subtitle(txt)
Create Multiline Subtitle
Create a plot, and add a title with the title
function. Then create a subtitle containing two lines of text by passing a cell array of character vectors to the subtitle
function. Each element in the array is a separate line of text.
plot([0 2],[1 5]) title('Straight Line') txt = {'Slope = 2','y-Intercept = 1'}; subtitle(txt)
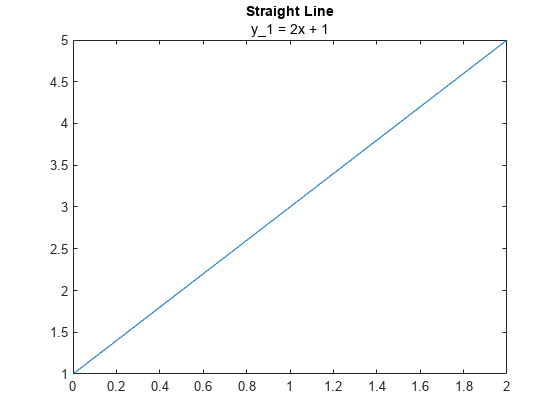
Display TeX Characters as Typed
Create a plot with a title. Then create a subtitle containing an underscore character that the TeX interpreter normally uses for subscripts. Set the Interpreter
to 'none'
when you call the subtitle
function, so that the underscore character appears in the subtitle.
plot([0 2],[1 5]) title('Straight Line') subtitle('y_1 = 2x + 1','Interpreter','none')
Change Alignment of Title and Subtitle
Create a plot and add a title and a subtitle. Get the current axes, and align the title and subtitle to the left edge of the plot box by setting the TitleHorizontalAlignment
property on the axes to 'left'
.
plot([0 2],[1 5]) title('Straight Line') subtitle('Slope = 2, y-Intercept = 1') ax = gca; ax.TitleHorizontalAlignment = 'left';
Center the title and subtitle by setting the TitleHorizontalAlignment
property on the axes to 'center'
.
ax.TitleHorizontalAlignment = 'center';
Specify Target Axes
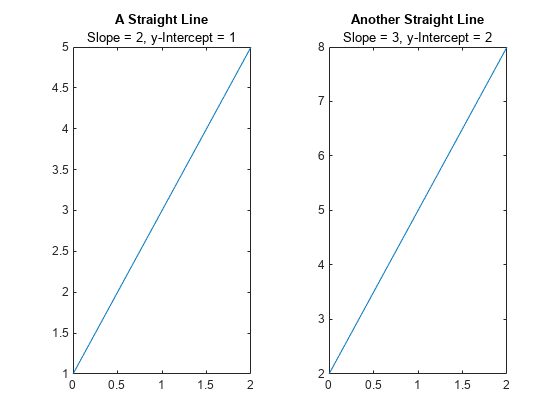
Create two plots in a tiled chart layout. Then add a title and subtitle to each plot.
t = tiledlayout(1,2); % Left plot ax1 = nexttile; plot([0 2],[1 5]) title(ax1,'A Straight Line') subtitle(ax1,'Slope = 2, y-Intercept = 1') % Right plot ax2 = nexttile; plot([0 2],[2 8]) title(ax2,'Another Straight Line') subtitle(ax2,'Slope = 3, y-Intercept = 2')
Input Arguments
txt
— Subtitle text
character vector | cell array of character vectors | string array
Subtitle text, specified as a character vector, cell array of character vectors, or a string array. To create multiple lines of text, specify a cell array of character vectors or a string array.
Example: subtitle('Single Line Subtitle')
Example: subtitle(["Subtitle With" "Multiple
Lines"])
target
— Target for the subtitle
axes | tiled chart layout | array of objects
Target for the subtitle, specified as one of the following:
Any type of axes: an
Axes
,PolarAxes
, orGeographicAxes
object.A
TiledChartLayout
object.An array of graphics objects from the preceding list. The objects must belong to the same class. To determine the class, use the
class
function.
If you do not specify the target for the subtitle, then the
subtitle
function adds the subtitle to the graphics object returned
by the gca
command.
Name-Value Arguments
Specify optional pairs of arguments as
Name1=Value1,...,NameN=ValueN
, where Name
is
the argument name and Value
is the corresponding value.
Name-value arguments must appear after other arguments, but the order of the
pairs does not matter.
Before R2021a, use commas to separate each name and value, and enclose
Name
in quotes.
Example: subtitle('My Subtitle','FontSize',12)
specifies a 12-point
font size.
Note
The properties listed here are only a subset. For a complete list, see Text Properties.
FontSize
— Font size
11
(default) | scalar value greater than 0
Font size, specified as a scalar value greater than 0
in point units. One point equals 1/72 inch. To change the font units, use the FontUnits
property.
If you add a title or subtitle to an axes object, then the font size property for the axes
also affects the font size for the title and subtitle. The title and subtitle font sizes
are the axes font size multiplied by a scale factor. The FontSize
property of the axes
contains the axes font size. The TitleFontSizeMultiplier
property of the axes contains the scale factor.
By default, the axes font size is 10 points and the scale factor is 1.1, so the title
and subtitle each have a font size of 11 points.
Data Types: single
| double
| int8
| int16
| int32
| int64
| uint8
| uint16
| uint32
| uint64
FontWeight
— Thickness of text characters
'normal'
(default) | 'bold'
Thickness of the text characters, specified as one of these values:
'normal'
— Normal weight as defined by the particular font'bold'
— Thicker characters outlines than normal
MATLAB® uses the FontWeight
property to select a font from
those available on your system. Not all fonts have a bold font weight. Therefore,
specifying a bold font weight could still result in the normal font weight.
The SubtitleFontWeight
property for the associated axes affects the
FontWeight
value for the subtitle.
Tips
By default, the
Interactions
property containseditInteraction
so the text can be edited by clicking on the text. To disable this interaction, set theInteractions
property of the text object to[]
.
Version History
Introduced in R2020b
Comando MATLAB
Hai fatto clic su un collegamento che corrisponde a questo comando MATLAB:
Esegui il comando inserendolo nella finestra di comando MATLAB. I browser web non supportano i comandi MATLAB.
Select a Web Site
Choose a web site to get translated content where available and see local events and offers. Based on your location, we recommend that you select: .
You can also select a web site from the following list:
How to Get Best Site Performance
Select the China site (in Chinese or English) for best site performance. Other MathWorks country sites are not optimized for visits from your location.
Americas
- América Latina (Español)
- Canada (English)
- United States (English)
Europe
- Belgium (English)
- Denmark (English)
- Deutschland (Deutsch)
- España (Español)
- Finland (English)
- France (Français)
- Ireland (English)
- Italia (Italiano)
- Luxembourg (English)
- Netherlands (English)
- Norway (English)
- Österreich (Deutsch)
- Portugal (English)
- Sweden (English)
- Switzerland
- United Kingdom (English)