Main Content

pattern

Plot array directivity and patterns

Since R2021a

Description

pattern(array,FREQ) plots the 3-D array directivity pattern (in dBi) for the array specified in array. The operating frequency is specified in FREQ. You can use this function to display the patterns of arrays that support polarization.

pattern(array,FREQ,AZ) plots the array directivity pattern at the specified azimuth angle.

pattern(array,FREQ,AZ,EL) plots the array directivity pattern at specified azimuth and elevation angles.

example

pattern(___,Name,Value) plots the array pattern with additional options specified by one or more Name,Value pair arguments.

[PAT,AZ_ANG,EL_ANG] = pattern(___) returns the array pattern in PAT. The AZ_ANG output contains the coordinate values corresponding to the rows of PAT. The EL_ANG output contains the coordinate values corresponding to the columns of PAT. If the 'CoordinateSystem' parameter is set to 'uv', then AZ_ANG contains the U coordinates of the pattern and EL_ANG contains the V coordinates of the pattern. Otherwise, they are in angular units in degrees. UV units are dimensionless.

Examples

collapse all

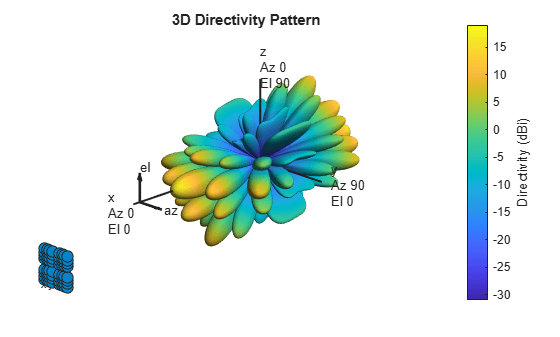
Construct a 5G antenna array where the grid is 2-by-2 and each panel is a 4-by-4 array. Each antenna element consists of two short-dipole antennas with different dipole axis directions. The antenna elements are spaced 1/2 wavelength apart and the panels are spaced 3 wavelengths apart. Plot the response pattern of the array assuming an operating frequency of 6 GHz.

c = physconst('LightSpeed');
fc = 6e9;
lambda = c/fc;
antenna1 = phased.ShortDipoleAntennaElement('AxisDirection','Z');
antenna2 = phased.ShortDipoleAntennaElement('AxisDirection','X');
array = phased.NRRectangularPanelArray('ElementSet', ...
        {antenna1, antenna2},'Size',[4, 4, 2, 2],'Spacing', ...
        [0.5*lambda, 0.5*lambda,3*lambda, 3*lambda]);
pattern(array,fc,'ShowArray',true)

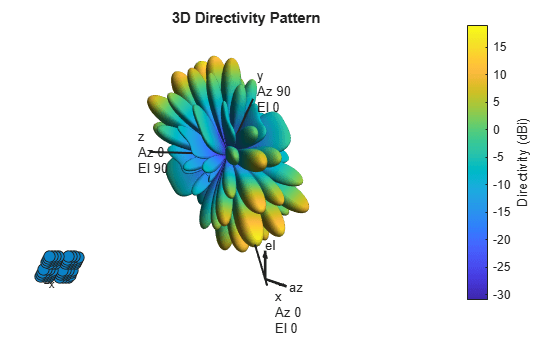
Use the Orientation property of pattern to change the orientation 80 along the x-axis, 30 along the y-axis and 60 along the z-axis.

pattern(array,fc,'Orientation',[80;30;60],'ShowArray',true)

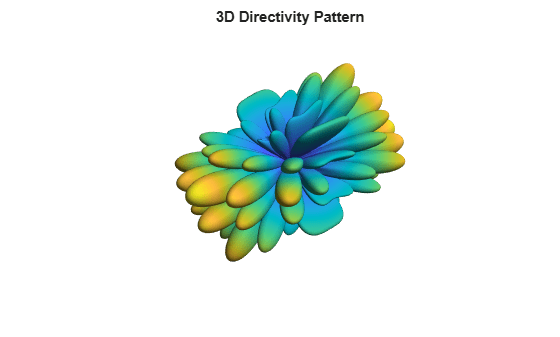
Disable the display of local coordinates and the colorbar.

pattern(array,fc,'ShowLocalCoordinate',false,'ShowColorBar',false)

Input Arguments

collapse all

Phased array, specified as a Phased Array System Toolbox System object.

Frequencies for computing directivity and patterns, specified as a positive scalar or 1-by-L real-valued row vector. Frequency units are in hertz.

  • For an antenna, microphone, or sonar hydrophone or projector element, FREQ must lie within the range of values specified by the FrequencyRange or FrequencyVector property of the element. Otherwise, the element produces no response and the directivity is returned as –Inf. Most elements use the FrequencyRange property except for phased.CustomAntennaElement and phased.CustomMicrophoneElement, which use the FrequencyVector property.

  • For an array of elements, FREQ must lie within the frequency range of the elements that make up the array. Otherwise, the array produces no response and the directivity is returned as –Inf.

Example: [1e8 2e6]

Data Types: double

Azimuth angles for computing directivity and pattern, specified as a 1-by-N real-valued row vector where N is the number of azimuth angles. Angle units are in degrees. Azimuth angles must lie between –180° and 180°.

The azimuth angle is the angle between the x-axis and the projection of the direction vector onto the xy plane. When measured from the x-axis toward the y-axis, this angle is positive.

Example: [-45:2:45]

Data Types: double

Elevation angles for computing directivity and pattern, specified as a 1-by-M real-valued row vector where M is the number of desired elevation directions. Angle units are in degrees. The elevation angle must lie between –90° and 90°.

The elevation angle is the angle between the direction vector and xy-plane. The elevation angle is positive when measured towards the z-axis.

Example: [-75:1:70]

Data Types: double

Name-Value Arguments

Specify optional pairs of arguments as Name1=Value1,...,NameN=ValueN, where Name is the argument name and Value is the corresponding value. Name-value arguments must appear after other arguments, but the order of the pairs does not matter.

Before R2021a, use commas to separate each name and value, and enclose Name in quotes.

Example: CoordinateSystem,'polar',Type,'directivity'

Plotting coordinate system of the pattern, specified as the comma-separated pair consisting of 'CoordinateSystem' and one of 'polar', 'rectangular', or 'uv'. When 'CoordinateSystem' is set to 'polar' or 'rectangular', the AZ and EL arguments specify the pattern azimuth and elevation, respectively. AZ values must lie between –180° and 180°. EL values must lie between –90° and 90°. If 'CoordinateSystem' is set to 'uv', AZ and EL then specify U and V coordinates, respectively. AZ and EL must lie between -1 and 1.

Example: 'uv'

Data Types: char

Displayed pattern type, specified as the comma-separated pair consisting of 'Type' and one of

  • 'directivity' — directivity pattern measured in dBi.

  • 'efield' — field pattern of the sensor or array. For acoustic sensors, the displayed pattern is for the scalar sound field.

  • 'power' — power pattern of the sensor or array defined as the square of the field pattern.

  • 'powerdb' — power pattern converted to dB.

Example: 'powerdb'

Data Types: char

Array orientation, specified as a 3-by-1 real-valued column vector containing the rotation angles with respect to the x-, y-, and z-axes of the local coordinate system, respectively.

Display normalized pattern, specified as the comma-separated pair consisting of 'Normalize' and a Boolean. Set this parameter to true to display a normalized pattern. This parameter does not apply when you set 'Type' to 'directivity'. Directivity patterns are already normalized.

Data Types: logical

View the array geometry along with the 3D radiation pattern, specified as false or true.

Data Types: logical

Show the local coordinate axes, specified as true or false.

Data Types: logical

Show the colorbar, specified as true or false.

Data Types: logical

Handle to the axes along which the array geometry is displayed specified as a scalar.

Plotting style, specified as the comma-separated pair consisting of 'Plotstyle' and either 'overlay' or 'waterfall'. This parameter applies when you specify multiple frequencies in FREQ in 2-D plots. You can draw 2-D plots by setting one of the arguments AZ or EL to a scalar.

Data Types: char

Polarization type, specified as the comma-separated pair consisting of 'Polarization' and either 'combined', 'H', or 'V'. If Polarization is 'combined', the horizontal and vertical polarization patterns are combined. If Polarization is 'H', only the horizontal polarization is displayed. If Polarization is 'V', only the vertical polarization is displayed.

Dependencies

To enable this property, set the array argument to an array that supports polarization and then set the 'Type' name-value pair to 'efield', 'power', or 'powerdb'.

Data Types: char | string

Signal propagation speed, specified as the comma-separated pair consisting of 'PropagationSpeed' and a positive scalar in meters per second.

Example: 'PropagationSpeed',physconst('LightSpeed')

Data Types: double

Array weights, specified as the comma-separated pair consisting of 'Weights' and an N-by-1 complex-valued column vector or N-by-L complex-valued matrix. Array weights are applied to the elements of the array to produce array steering, tapering, or both. The dimension N is the number of elements in the array. The dimension L is the number of frequencies specified by FREQ.

Weights DimensionFREQ DimensionPurpose
N-by-1 complex-valued column vectorScalar or 1-by-L row vectorApplies a set of weights for the single frequency or for all L frequencies.
N-by-L complex-valued matrix1-by-L row vectorApplies each of the L columns of 'Weights' for the corresponding frequency in FREQ.

Note

Use complex weights to steer the array response toward different directions. You can create weights using the phased.SteeringVector System object or you can compute your own weights. In general, you apply Hermitian conjugation before using weights in any Phased Array System Toolbox function or System object such as phased.Radiator or phased.Collector. However, for the directivity, pattern, patternAzimuth, and patternElevation methods of any array System object use the steering vector without conjugation.

Example: 'Weights',ones(N,M)

Data Types: double
Complex Number Support: Yes

Output Arguments

collapse all

Array pattern, returned as an N-by-M real-valued matrix. The pattern is a function of azimuth and elevation. The rows of PAT correspond to the azimuth angles in the vector specified by EL_ANG. The columns correspond to the elevation angles in the vector specified by AZ_ANG.

Azimuth angles for displaying directivity or response pattern, returned as a scalar or 1-by-N real-valued row vector corresponding to the dimension set in AZ. The columns of PAT correspond to the values in AZ_ANG. Units are in degrees.

Elevation angles for displaying directivity or response, returned as a scalar or 1-by-M real-valued row vector corresponding to the dimension set in EL. The rows of PAT correspond to the values in EL_ANG. Units are in degrees.

More About

collapse all

Directivity

Directivity describes the directionality of the radiation pattern of a sensor element or array of sensor elements.

Higher directivity is desired when you want to transmit more radiation in a specific direction. Directivity is the ratio of the transmitted radiant intensity in a specified direction to the radiant intensity transmitted by an isotropic radiator with the same total transmitted power

D=4πUrad(θ,φ)Ptotal

where Urad(θ,φ) is the radiant intensity of a transmitter in the direction (θ,φ) and Ptotal is the total power transmitted by an isotropic radiator. For a receiving element or array, directivity measures the sensitivity toward radiation arriving from a specific direction. The principle of reciprocity shows that the directivity of an element or array used for reception equals the directivity of the same element or array used for transmission. When converted to decibels, the directivity is denoted as dBi. For information on directivity, read the notes on Element Directivity and Array Directivity.

Azimuth and Elevation Angles

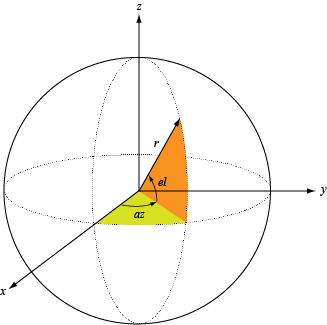
Define the azimuth and elevation conventions used in the toolbox.

The azimuth angle of a vector is the angle between the x-axis and its orthogonal projection onto the xy-plane. The angle is positive when going from the x-axis toward the y-axis. Azimuth angles lie between –180° and 180° degrees, inclusive. The elevation angle is the angle between the vector and its orthogonal projection onto the xy-plane. The angle is positive when going toward the positive z-axis from the xy-plane. Elevation angles lie between –90° and 90° degrees, inclusive.

Version History

Introduced in R2021a