Create Labels and Label Multi-Sensor Data
R2026bAfter loading signals into the Multi-Sensor Labeler app, as described in the Load and View Multi-Sensor Data procedure, create label definitions and label the signal frames.
Create ROI Label Definitions
Label definitions contain the information about the labels that
you mark on the signals. You can create label definitions interactively within the app
or programmatically by using a labelDefinitionCreatorMultiSensor object.
An ROI label is a label that corresponds to a region of interest (ROI) in a signal frame. You can define these ROI label types in the Multi-Sensor Labeler app:
Rectangle/Cuboid— Draw axis-aligned bounding box labels around objects, such as vehicles. In image signals, you draw labels of this type as 2-D rectangular bounding boxes. In point cloud signals, you draw labels of this type as 3-D cuboid bounding boxes.Rotated Rectangle— Draw 2-D bounding box labels around objects in an image that are rotated.Point— Draw a point label in an image signal to identify an object.Line— Draw linear ROIs to label lines, such as lane boundaries. Supported in both image and point cloud signals.Projected Cuboid— Draw 3-D bounding box labels around objects in an image, such as vehicles.Polygon— Draw polygon labels around objects. You can label distinct instances of the same class.Pixel— Draw pixels to label various classes, such as road or sky, for semantic segmentation of image data.Semantic Point— Label individual points in a point cloud for per-point semantic classification. This label type was previously named Voxel ROI. For more details, see Semantic Point Labeling.
Create an ROI label definition:
In the Labeler tab, from the toolstrip, click Add Label and select the desired label type.
In the Define New Label dialog box, specify a Label Name.
From the
Grouplist, selectNew Groupand name the group. Adding labels to groups is optional.Click OK. The group name appears on the ROI Label Definitions pane with the label name under it.
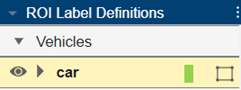
A Rectangle/Cuboid label is drawn differently on each
signal type. On image signals, the label is drawn as a 2-D rectangular bounding box of
type Rectangle. On point cloud signals, the label is drawn as a 3-D
cuboid bounding box of type Cuboid.
Create ROI Sublabel
A sublabel is a type of ROI label that corresponds to a parent ROI label. Each sublabel must belong to, or be a child of, a label definition that is in the ROI Label Definitions pane. For example, in a driving scene, a vehicle label can have sublabels for headlights, license plates, or wheels.
Create an ROI sublabel definition:
Select the parent label of the sublabel. On the ROI Label Definitions pane in the left pane, click the parent label to select it.
In the Labeler tab, from the toolstrip, click Sublabel, and select the sublabel type (for example,
Rectangle).In the Define New Sublabel dialog box, specify a Sublabel Name. Click OK.
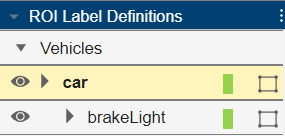
The sublabel appears in the ROI Label Definitions pane under the parent label. The sublabel and parent label have the same color.
Note
Sublabels are supported for Rectangle, Rotated Rectangle, Line, Polygon and Projected Cuboid label types on image signals only. Cuboid, Pixel, Point and Semantic Point labels do not support sublabels.
Create ROI Attribute
An ROI attribute specifies additional information about an ROI label or sublabel. For example, in a driving scene, attributes can include the type or color of a vehicle. You can define ROI attributes of these types:
List— Specify a drop-down list attribute of predefined strings, such as make or model of a vehicle.Numeric— Specify a numeric scalar attribute, such as the number of doors on a labeled vehicle.String— Specify a string scalar attribute, such as the color of a vehicle.Logical— Specify a logical true or false attribute, such as whether a vehicle is in motion.
Create an attribute:
On the ROI Label Definitions pane, select the label or sublabel to which you want to add the attribute.
In the Labeler tab, from the toolstrip, click Attribute, and select the attribute type from the list.
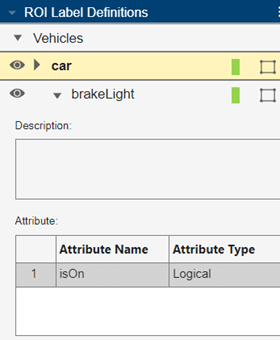
In the Define New Attribute dialog box, specify an Attribute Name. Optionally set a default value and provide a description. Click OK.
Create Scene Label
A scene label defines additional information across all signals in a scene. Use scene labels to describe conditions, such as lighting and weather, or events, such as lane changes.
Create a scene label definition:
In the Labeler tab, from the toolstrip, click Add Label, and select Scene from the list.
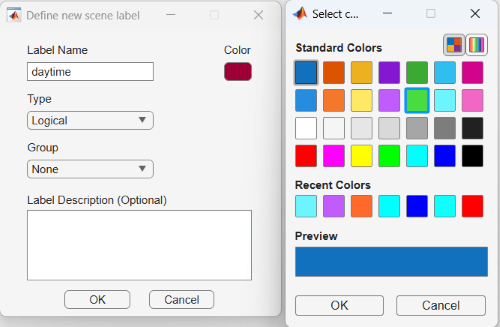
In the Define new scene label dialog box, specify Label Name and Type. Scene labels can either be logical, numeric or string values.
Choose a Color for the label by clicking the color preview and selecting a color.
Optionally, from the
Grouplist, selectNew Groupand name the group.Click OK. The Scene Label Definitions pane shows the scene label definition.
Verify Label Definitions
Verify that your label definitions are set up correctly:
The ROI Label Definitions pane contains the expected groups and labels with the correct types.
Sublabels appear under their parent labels.
Attributes appear under their associated labels or sublabels.
The Scene Label Definitions pane contains the expected scene labels.
Semantic Point ROI labels appear with the correct label names for per-point classification.
To edit or delete a label or sublabel definition, select the desired label or sublabel definition. Then, from the app toolstrip, click Edit or Delete.
To edit or delete an attribute, right-click that attribute and select the appropriate edit or delete option.
To save these label definitions to a MAT-file for use in future labeling sessions, on the app toolstrip, first select Export. Then, in the Label Definitions section, select To File.
To reorder label definitions or move them to different groups, you can drag and drop them in the label definition panes.
Label Video Using Automation
Note
Labeling Images and Videos in Multi-Sensor-Labeler app requires Computer Vision Toolbox™.
Use the built-in automation algorithms to label objects in video signals. For example, use the Temporal Interpolator to label a car across multiple frames:
Select the time range to label. In the text boxes below the video, specify the start and end times for the interval. The app sets the range slider and text boxes and displays signal frames only from the specified interval. The red flags indicate the start and end of the interval. You can also click the blue interval icon below the slider to expand the time range to fill the entire playback section.

In the ROI Label Definitions pane, click the label definition you want to automate.
From Automate Labeling section of the app toolstrip, select Select Algorithm > Temporal Interpolator. This algorithm estimates rectangle ROIs between image frames by interpolating the ROI locations across the time range.
Click Select Signals. In the Select Signals window, select only the video signal and click OK. This algorithm supports labeling of only one signal at a time.
Click Automate. An automation session for the video opens.
At the start of the time range, click and drag to draw a label around the target object. For this algorithm, you can draw only one label per frame.
Drag the slider to the last frame and draw the same label around the same object. Optionally, label intermediate frames to improve results.
From the Automate tab on the toolstrip, click Run. The automation algorithm applies the label to the intermediate frames.
When satisfied with the results, click Accept to close the session and apply the labels.
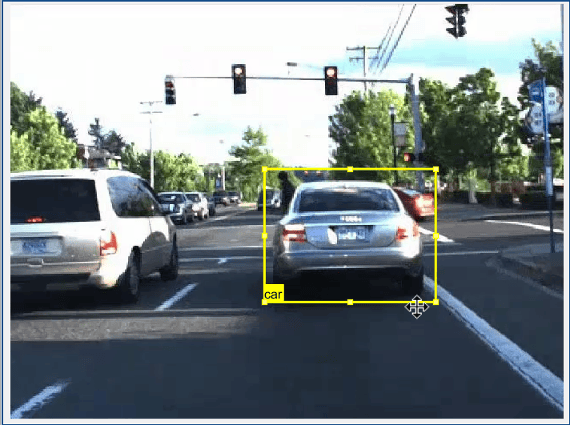
By default, labels appear only when you move your pointer over them. To always display
labels, from the Visualization tab on the app toolstrip, set
Show ROI Labels to Always.
Label Point Cloud Using Automation
Use automation algorithms designed for point cloud labeling, such as the Point Cloud Temporal Interpolator:
In the labeling window, click the point cloud signal to select it.
In the ROI Label Definitions pane, click the label definition (for example, a Rectangle/Cuboid label).
From Automate Labeling section of the app toolstrip , select Select Algorithm > Point Cloud Temporal Interpolator. This algorithm estimates cuboid ROIs between point cloud frames by interpolating the ROI locations across the time range.
Click Select Signals, select only the point cloud signal, and click OK.
Click Automate. An automation session for the point cloud opens.
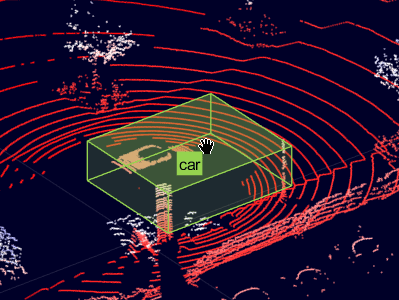
At the start of the time range, draw a cuboid label around the target object. . Click the point cloud signal frame to create the label and zoom in using the scroll wheel.

The label snaps to the highlighted portion of the point cloud. Adjust the cuboid until it fully encloses the object. To resize the cuboid, click and drag one of the cuboid faces. To move the cuboid, hold Shift and click and drag one of the cuboid faces.
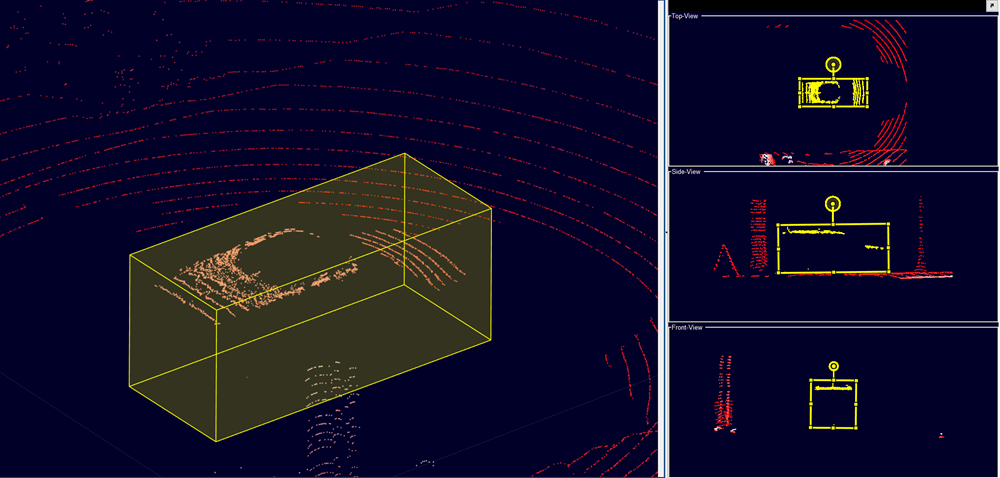
Use projected view to adjust the cuboid label in top-view, side-view and front-view simultaneously. Under the Point Cloud tab in the app toolstrip, select the Projected View option from the Camera View section.
Copy the cuboid (Ctrl+C) and paste it (Ctrl+V) into the last frame. Optionally adjust the position.
From the Automate tab, click Run. The algorithm applies the label to intermediate frames.
Click Accept to close the session and apply the labels.
Refine and Adjust Point Cloud Labels
After drawing or automating cuboid labels, use the refinement tools on the Point Cloud tab to improve label accuracy. These tools help you precisely fit labels to sparse 3-D data points.
Projected View
Select Projected View to view the front-view, top-view, and side-view of the selected label simultaneously. Use these views to manually adjust the position and size of your cuboid labels from multiple perspectives.
Auto Align Labels
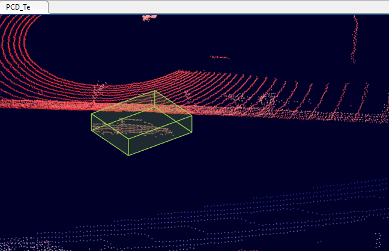
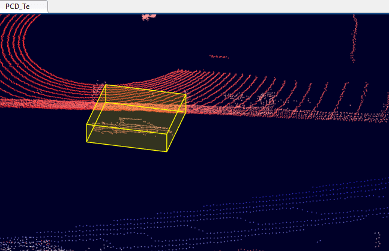
Select Auto Align to fit a cuboid accurately to the label data and align the label in the direction of the object. This feature centers and orients the cuboid on the labeled point cluster for improved accuracy.
| Label without Auto Align option | Label with Auto Align option |
|
|
|
Snap and Shrink Labels
On the Point Cloud tab, use these options to snap and shrink your labels to fit the points.
Shrink To Fit — Shrink the size of cuboid labels to best fit the labeled points.
Snap To Cluster — Snap labels to best fit the selected point clusters. You can also specify which clustering algorithm to use to fine-tune the point clusters, by selecting Cluster Settings.
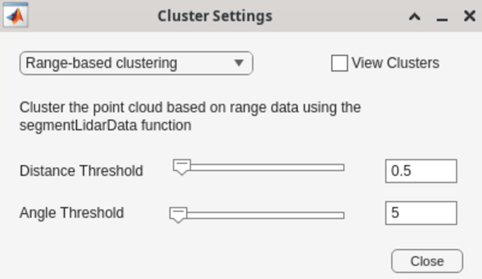
Select
Range-based clusteringto cluster point cloud data using thesegmentLidarDatafunction. This option is not applicable for unorganized point cloud data.Select
Distance-based
                                            clustering
to cluster point cloud data using thepcsegdistfunction.
You can specify the algorithm parameters in the Cluster Settings dialog box. To visualize the output point cloud clusters, select the View Clusters parameter.
Snap to Point — Snap the line label vertex to the nearest point in the point cloud.
Tip
For more visualization options, see Visualize Point Cloud Data.
Semantic Point Labeling
When you define a Semantic Point ROI label, the app opens
the Semantic Point tab. You can draw and fine-tune the semantic
point regions on a point cloud to label them.

Tip
To undo or redo a labeling action in the Semantic Point tab, press Ctrl+Z or Ctrl+Y, respectively.
Burst Mode Labeling
Burst Mode is a semi-automated labeling feature for point cloud
signals that enables you to label static or semi-static objects across multiple
timestamps at once. Burst mode operates on one selected point cloud signal, merges point
clouds across a selected time range into a single view, and applies annotations across
all timestamps in that range. It supports Cuboid and
Semantic Point ROI labels only.
To use burst mode, follow these steps:
Select a point cloud signal and a Cuboid or Semantic Point ROI label definition.
Click Burst Mode in the range slider pane.

Draw labels on the merged point cloud.
Click Accept and Exit to apply labels across all timestamps, or Exit to discard changes.
For detailed information on burst mode workflow, entry conditions, and UI behavior, see the Burst Mode section in Automate Labeling for Multi-Sensor Data.
Label with Sublabels and Attributes Manually
Manually label a frame of a video signal with sublabels and attributes. Point cloud signals do not support sublabels and attributes for cuboid or semantic point labels.
Verify the time range is set to the desired interval.
In the ROI Label Definitions tab, click the sublabel definition to select it.
If needed, hide the point cloud signal. On the Labeler tab of the app toolstrip, in the Layout section, under Show/Hide Signals, clear the check mark for the point cloud signal. Hiding a signal only hides the display. The app maintains the labels for hidden signals, and you can still export them.
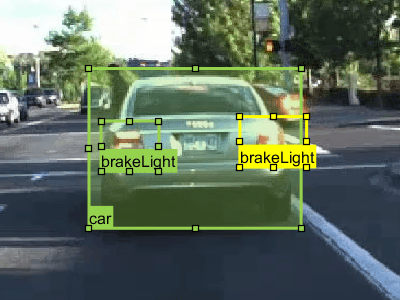
In the image frame, select the parent ROI label. The label turns yellow. You must select the parent label before you can add a sublabel to it.
Draw sublabels on the target regions within the parent label.
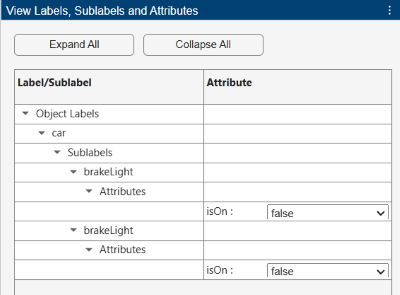
On the right, the View Labels, Sublabels and Attributes pane shows all the ROI and scene labels, sublabels, and their corresponding attributes present in the current frame. Set the attribute values as needed.
Label Scene Manually
Apply a scene label to the signal frames:
Expand the time range to the desired duration. Drag the red flags to set the start and end of the range slider.
From the Scene Label Definitions tab, select the scene label definition.
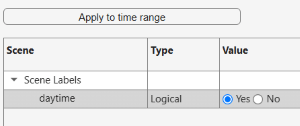
In the View Labels, Sublabels and Attributes, select the appropriate scene label value. Click Apply to Time Range. A check mark appears for the scene label indicating that the label now applies to all frames in the time range.
View Label Summary
With labels applied to at least one frame of a signal, you can view a visual summary
of the ground truth labels. On the Labeler tab of the app
toolstrip, click View Label Summary. For logical scene labels,
false indicates absence of labels whereas for numeric and string
scene labels, an empty value indicates the absence of that labels.
Save App Session
Save your labeling session to preserve the data source, label definitions, and labeled ground truth data. The saved session also includes your session preferences, such as the layout of the app.
On the app toolstrip, you can manage sessions using these options:
Select Save Project, and then either Save or Save As, to save the current labeling session.
Click New Project to start a new session. In the dialog box that opens, specify a session folder.
Click Open Project, and select one of the listed recent sessions, or navigate to the folder of a previous session.
You can now either close the app session or continue to the Automate Labeling for Multi-Sensor Data step or the Export Multi-Sensor Ground Truth and Create Training Data step.
Programmatic Label Creation and Import
You can create label definitions and label data programmatically, then import them into the Multi-Sensor Labeler app. This workflow is useful for reusing label definitions across sessions or importing labels generated by external algorithms.
To programmatically create and import ground truth data:
Create label definitions using the
labelDefinitionCreatorMultiSensorobject. Add ROI labels, sublabels, attributes, and scene labels as needed.Create data sources for each signal using the appropriate source class (for example,
vision.labeler.loading.VideoSourceorvision.labeler.loading.PointCloudSequenceSource).Create label data as timetables for each signal with timestamps as row times and label names as variable names. Store the label data in a
vision.labeler.labeldata.ROILabelDataobject and scene label data in avision.labeler.labeldata.SceneLabelDataobject.Construct a
groundTruthMultiSensorobject from the data sources, label definitions, ROI label data, and scene label data.Import the ground truth into the app. On the Labeler tab, click Import > Labels, and select
From WorkspaceorFrom File.
To import only label definitions without label data, on the Labeler tab, click Import > Label Definitions.
For the complete programmatic workflow with code examples, see groundTruthMultiSensor.
See Also
Multi-Sensor
Labeler | labelDefinitionCreatorMultiSensor | groundTruthMultiSensor

