Dashboard in Polyspace Access Web Interface
The Dashboard perspective provides an overview of the analysis results in graphical format, with clickable fields that let you drill down into your results by project, file, or category.
When you upload an analysis run to the Polyspace® Access database, the dashboard updates to display the statistics for the latest run.
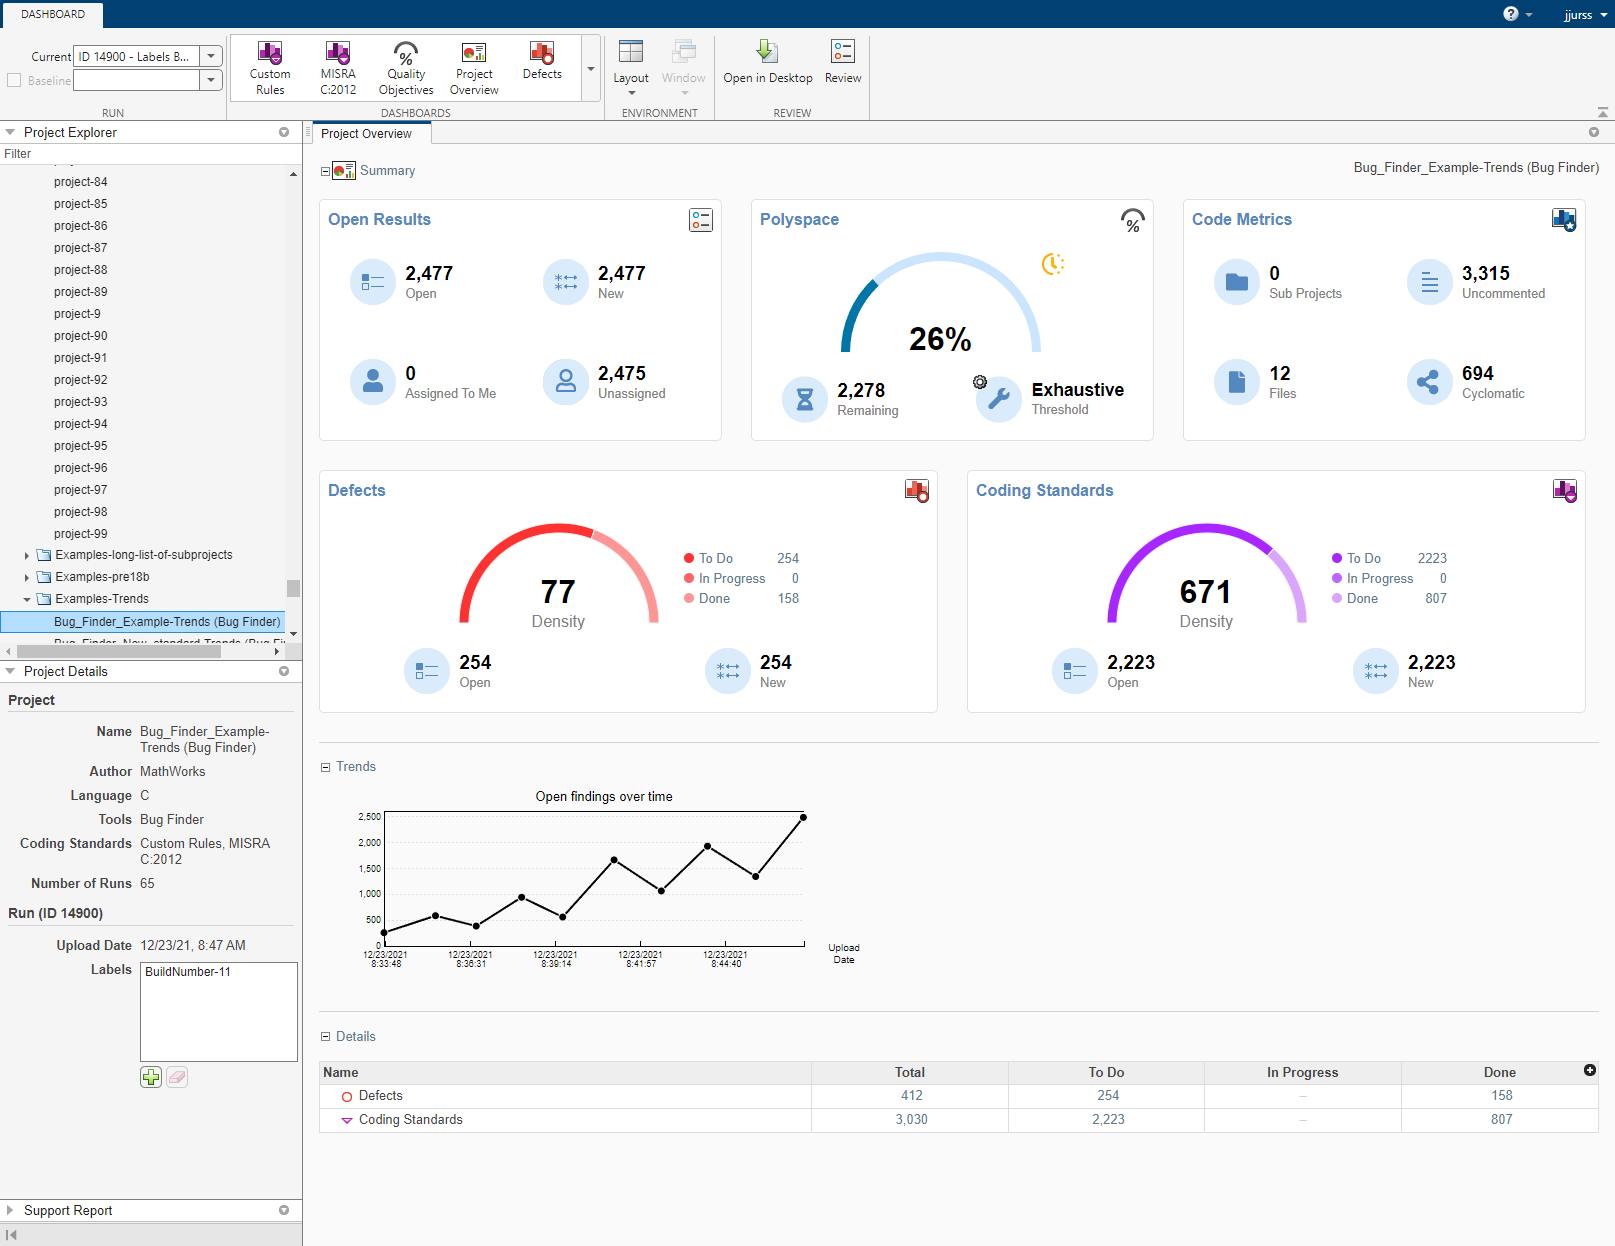
On the Project Overview dashboard, you see statistics for the currently selected project. When you select a folder in the Project Explorer, you see aggregate statistics for all of the projects under that folder. The aggregate data does not include the statistics of projects for which you do not have a role of Administrator, Owner, or Contributor.
In the Summary section of the Project Overview dashboard, cards display information about open issues, code metrics, quality objectives, and the different families of results. For example:
The Run-time Check card (Code Prover) shows the distribution of checks as red, orange, gray, and green. The card also shows Selectivity, the number of green checks as a percentage of all detected run-time checks.
Defects and Coding Standards cards show a distribution of results by Open (
Unreviewed,To fix,To investigate, orOther) and Done (Justified,Not a defect, orNo action planned).The card also shows Density, the number of Open defects or coding standard violations per one thousand lines of code without comments. To view the density you must enable Code Metrics in your analysis.
Note
Green run-time checks, green shared variables, not shared variables, and code metrics do not count toward the number of To Do, In Progress, and Done results.
The Quality Objectives card displays your selected software quality objectives (SQOs) for the project as well as the current percentage of results already addressed to achieve the selected threshold.
To see a more in-depth overview for a family of results, open additional dashboards by clicking the corresponding card title in the Project Overview dashboard or by using the Dashboards gallery in the toolstrip.
The Trends section of the Project Overview dashboard displays a graph showing the total number of open results over time. You can zoom and pan through the graph to investigate the number of incoming results at a high level. Each time you upload a run to Polyspace Access, the trend graph for that project is updated with the latest information, for up to 1000 runs.
The Details section displays a table that allows you to drill down into the results by category. If you select a folder that contains multiple projects, you can also drill down into the results by project.
You can perform these actions on the Dashboard perspective:
View statistics for a previous run or compare a current run to a previous run. See Compare Results in Polyspace Access Project to Previous Runs.
Click elements on the graphs or tables to filter results from the Results List pane. See Filter and Sort Results in Polyspace Access Web Interface.
Define and set quality objective levels. See Monitor Code Quality Using Quality Objectives Dashboard in Polyspace Access.
Manage projects and user authorizations. See Manage Permissions in Polyspace Access Web Interface.