Calculate Code Profiling Metrics in Microsoft Visual Studio
Using Polyspace® Test™, you can calculate C/C++ code execution metrics, such as code coverage, execution time, and memory use:
Code coveragemeasures how much of your code is covered by the existing test cases.Execution timecomputes how much execution time and dynamic resources are spent by the different callable entities in your code.Memory usemeasures how the callable entities use the available stack memory.
If you use the Microsoft® Visual Studio® development environment, you can calculate these metrics using a Visual Studio project:
Using a Polyspace Platform project — Create a Polyspace Platform project from your Visual Studio project. Add test cases to the Polyspace Platform project and calculate the code profiling metrics in the Polyspace Platform user interface. See Create Polyspace Platform Projects From IDE Builds.
Without using a Polyspace Platform project — Add Polyspace Test xUnit API-based C/C++ tests to your Visual Studio project and calculate your code profiling metrics in the Developer Command Prompt for Visual Studio.
This example shows how to add xUnit-based tests to your Visual Studio project and calculate code profiling metrics in the Developer Command Prompt for Visual Studio.
Prerequisites
To follow this example:
You require a valid Microsoft Visual Studio license.
Compile your project without precompiled Visual Studio headers. The precompiled headers are incompatible with Polyspace Test.
Copy the content of the folder
<polyspaceroot>\polyspace\examples\doc_pstest\cpp_exampleto a writable location. Here,<polyspaceroot>is the Polyspace installation folder, for example,C:\Program Files\Polyspace\R2026a.
Create and Configure Microsoft Visual Studio Project
Add the source and test files in a Visual Studio project and configure the project so that it builds correctly:
Create a new project
cpp_example.To open the
cpp_exampleProperty window, right click the project in the Solution Explorer and select Properties. In the window:Make
x64the active platform for project build. For example, in Visual Studio 2019, select the Configuration Manager button and set the Platform for Build tox64.In the VC++ Directories pane, enter these paths in the list of Include Directories:
<polyspaceroot>\polyspace\pstest\pstunit\include<polyspaceroot>\polyspace\pstest\pstunit\src
Add these files to the Source Files node in the Solution Explorer:
ranks.cppandsuite_test.cpp. These are the files you copied from the folder<polyspaceroot>\polyspace\examples\doc_pstest\cpp_example.<polyspaceroot>\polyspace\pstest\pstunit\src\pstunit.cpp
Add the file
ranks.hppto the Header Files node in the Solution Explorer.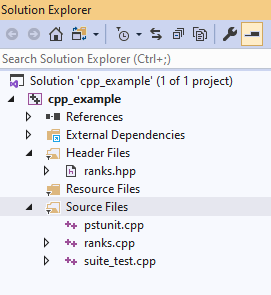
After configuring the project, verify that the solution builds without error.
Open the Developer Command Prompt for Visual Studio.
Browse to the folder containing your
cpp_example.vcxprojand then enter:Verify that there are no error messages.msbuild <cpp_example.vcxproj> /t:rebuild -p:platform=x64
Navigate to the folder
x64\Debugand enter:cpp_example.exe
Verify that the source passes the four tests.
|        |  Total | Passed | Failed | Incomplete
|--------|--------|--------|--------|------------
| Suites |      2 |      2 |      0 |          0
|  Tests |      4 |      4 |      0 |          0
Generate Code Profiling Metrics
To calculate code profiling metrics, Polyspace Test inserts profiling macros in a copy of your source code and creates an instrumented test executable from the copied source code. You generate code profiling metrics by running the instrumented test executable.
Generate Instrumented Test Executable
To generate the instrumented test executable, instrument the source files and then build the instrumented source files. At the Developer Command Prompt, navigate to the folder containing the cpp_example.vcxproj file.
If you want to calculate code coverage metrics, at the Developer Command Prompt, enter:
polyspace-code-profiler -instrument -instrum-dir <instrumfolder> -cov-metric-level mcdc -instrument-in-place -ignore-file "<path_to_pstunit.cpp>" -ignore-file "<path_to_suite_test.cpp>" -msbuild -- msbuild cpp_example.vcxproj /t:rebuild -p:platform=x64
If you want to calculate execution time metrics, at the Developer Command Prompt, enter:
polyspace-code-profiler -instrument -instrum-dir <instrumfolder> -exec-metric-level detailed -prof-counter-size 64 -instrument-in-place -ignore-file "<path_to_pstunit.cpp>" -ignore-file "<path_to_suite_test.cpp>" -msbuild -- msbuild cpp_example.vcxproj /t:rebuild -p:platform=x64
If you want to calculate memory use metrics, at the Developer Command Prompt, enter:
polyspace-code-profiler -instrument -instrum-dir <instrumfolderCov> -stack-metric-level detailed -prof-counter-size 64 -instrument-in-place -ignore-file "<path_to_pstunit.cpp>" -ignore-file "<path_to_suite_test.cpp>" -msbuild -- msbuild cpp_example.vcxproj /t:rebuild -p:platform=x64
This command:
Excludes the files
pstunit.cppandsuite_test.cppfrom instrumentation by using-ignore-file.Specifies the options
-instrument-in-placeand-msbuild. These options are required when instrumenting source code directly from your Visual Studio solution.Specifies a writable folder
<instrumFolder>where you store the instrumented code and database.Specifies a value for
-cov-metric-level. The default value isdecision. To calculate the code coverage of all supported coverage metrics, use the valuemcdc.Specifies a value for
prof-counter-size. This option is required for calculating execution time or memory use metrics.
You can calculate only one of the code coverage, execution time, or memory use metrics at a time. To calculate more than one of these metrics, perform the calculations separately.
Instrumented source files and database files are saved in <instrumfolder>. Polyspace
Test builds the project and stores the instrumented test executable in the folder x64/Debug/.
Run Instrumented Test Executable
Run the instrumented test executable and calculate the code profiling metrics. At the Developer Command Prompt, enter:
polyspace-code-profiler -run -instrum-dir <instrumfolder> -results-dir <runfolder> -- "x64/Debug/<cpp_example.exe>"
Specify the folder <instrumfolde> as the input to
-instrum-dir.Specify a writable folder <runfolder> as the input to
-results-dir. Theruncommand generates the profiling results file (.psprof) from the instrumented code and stores the file in the <runfolder>.Specify the location of the instrumented test executable. In this example, this test executable is in the folder
x64/Debug/<cpp_example.exe>.
This step generates the code profiling database and saves the .bin and .psprof files in the folder <runfolder>.
Create HTML Reports
After generating the required results (.psprof) files, create readable HTML reports.
To create the HTML report, at the command prompt, enter:
polyspace-code-profiler -report -html -report-dir <reportfolder> <runfolder>
Specify <runfolder>, which is the folder containing the profiling data, as the argument to
resultsPath.Specify <reportfolder> as the input to
-report-dir.Specify the format of the report as
-html.
The generated HTML report is stored in <reportfolder>. To view the report, open the file
<reportfolder>/ranks.cpp.html.
Review Reports
Review the results in the file <reportfolderCov>/ranks.cpp.html. For this example, Polyspace
Test reports these code coverage results:
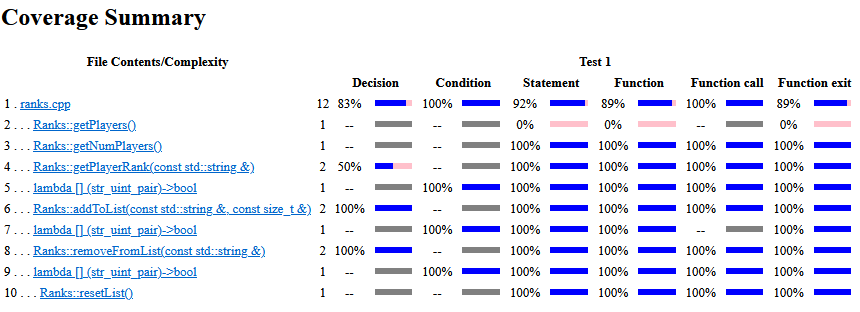
The summary indicates that some functions have incomplete code coverage. For example, the function getPlayerRank has a 50% value for the Decision Coverage. In order to obtain 100% coverage, add new tests. Alternatively, you can justify the low coverage. See Improve or Justify Missing Code Coverage Results.
If you calculate the execution time metrics, open the report located in <reportfolderexec>/ranks.cpp.html to review the results.
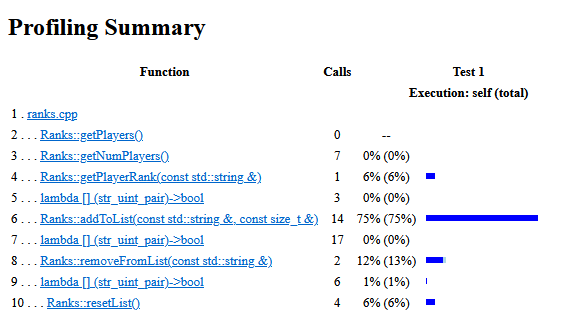
You see that the code calls the function addToList 14 times and the execution spends 75% of the total execution time in this function. Enhancing performance of this function can improve the efficiency of your code. You can check for issues that impact performance of this function by using the Polyspace
Bug Finder™ performance defects. See Performance Defects (Polyspace Bug Finder).