Model Development and Experiment Manager
This example shows how to use Experiment Manager with Modelscape™ at different stages of model development.
In this example, you set up experiments, use Modelscape validation metrics in the process, and bridge the gap between Experiment Manager and model documentation. You use a feature selection process that works through all the subsets of the predictors to find the best subset using the performance metric of the area under the receiver operating characteristic (AUROC). Although this exhaustive feature selection is computationally intensive, it is an effective way to compare methods in the process of model validation.
This example uses the CreditCardData data set, which contains three tables of customer information, such as age, income, and employment status. After excluding the response variable (status) and the customer identifier (ID), this data set has nine possible predictors. You create an experiment with nine trials such that the Kth trial runs through all the K-element subsets of the maximal, nine-element predictor set. You then set up hyperparameters, write and run the experiment, and document the experiment results.
Write Experiment in Experiment Manager
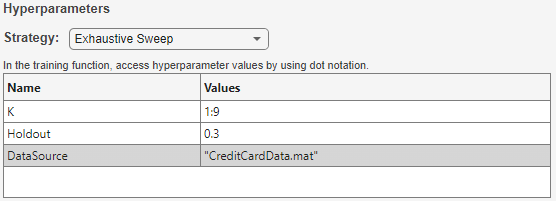
Load the Experiment Manager app from the Apps tab. Create a blank project and select Custom Training under Blank Experiments. Set a hyperparameter K to control the number of predictors in each trial, and other hyperparameters to control the training and test sets used in all the trials, as shown in the table below.
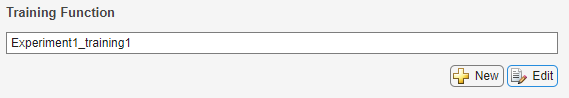
To write the experiment function, click Edit underneath the Training Function box.
This opens a live script with an empty function body. Fill in the function written below. The function takes as inputs params, a struct whose fields correspond to the given hyperparameters (in this case K), and monitor, an experiments.Monitor object.
function output = Experiment1_training1(params,monitor)
    allData = load(params.DataSource);

    rng("default");
    partition = cvpartition(1200,"Holdout",params.Holdout);
    trainingData = allData.data(partition.training,:);
    testData = allData.data(partition.test,:);

    monitor.Metrics = "AUROC";
    monitor.Info = ["MaxAUROC","InSampleAUROC","MeanAUROC","StdDevAUROC"];
    allVars = trainingData.Properties.VariableNames;
    predictorFlags = ~ismember(allVars,["status","CustID"]);
    predictorVars = allVars(predictorFlags);

    N = numel(predictorVars);
    K = params.K;
    numRuns = nchoosek(N,K);
    masks = mrm.data.filter.allMasks(N,K);
    bestAUROC = 0;
    bestInSampleAUROC = 0;
    allAurocs = zeros(numRuns,1);

    for i = 1:numRuns
        % Choose a set of predictors
        thesePredictors = predictorVars(masks{i});

        % Fit the model for these predictors
        sc = creditscorecard(trainingData, ...
            'IDVar', 'CustID', ...
            'ResponseVar', 'status', ...
            'GoodLabel', 0, ...
            'BinMissingData', true, ...
            'PredictorVars', thesePredictors);
        sc = autobinning(sc);
        sc = fitmodel(sc,"VariableSelection","fullmodel");
        monitor.Progress = i/numRuns*100;

        % Evaluate model on test data
        iScores = score(sc, testData);

        % Record performance metrics
        aurocMetric = mrm.data.validation.pd.AUROC(testData.status,iScores);
        recordMetrics(monitor,i,"AUROC",aurocMetric.Value);
        allAurocs(i) = aurocMetric.Value;
        if aurocMetric.Value > bestAUROC
            bestAUROC = aurocMetric.Value;
            updateInfo(monitor,"MaxAUROC",aurocMetric.Value);
            output.model = sc;
            output.predictors = thesePredictors;
        end

        % Record in-sample auroc
        inSampleScores = score(sc, trainingData);
        inSampleAUROC = mrm.data.validation.pd.AUROC(trainingData.status, inSampleScores);
        if inSampleAUROC.Value > bestInSampleAUROC
            bestInSampleAUROC = inSampleAUROC.Value;
            updateInfo(monitor,"InSampleAUROC",inSampleAUROC.Value);
        end
    end
    updateInfo(monitor,"StdDevAUROC",std(allAurocs),"MeanAUROC",mean(allAurocs));
end
The Monitor object can record two types of data: metrics and information.
Metrics are parameterized data. In this example, the index of the predictor subset parameterizes the data. Save metric levels by calling
recordMetrics.Information fields carry a single datum per trial. Save information fields by calling
updateInfo.
You can write several metrics and information fields. This example reports the maximum, mean, and standard deviation of all the recorded out-of-sample AUROC scores. Use this data to compare the distribution of the achieved AUROC values with the mean value. The experiment also records the maximal achieved in-sample score for sanity checking purposes.
The output of the experiment consists of the optimal set of predictors and a model fitted using that subset.
Analyze Experiment Results
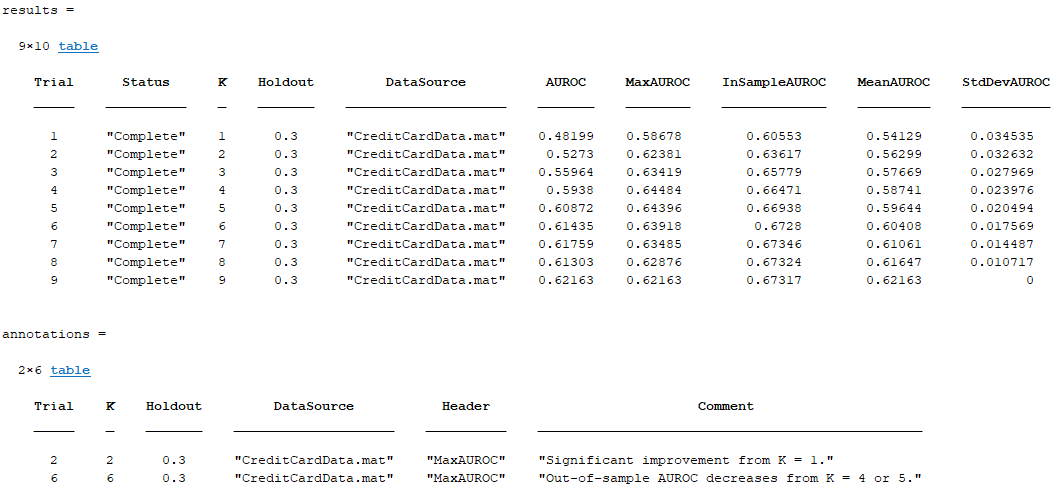
Run the experiment. The software generates this table.
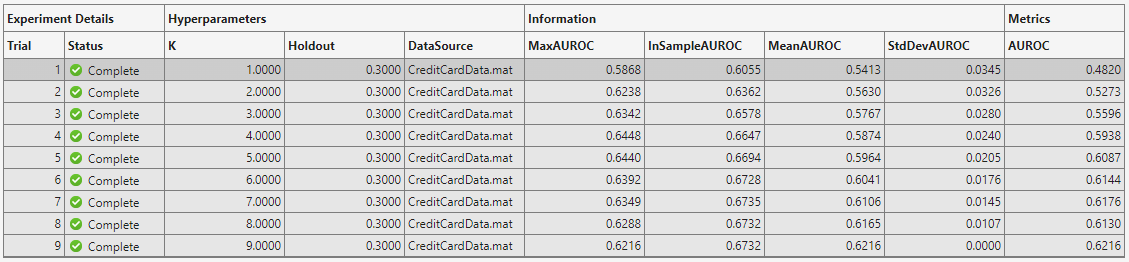
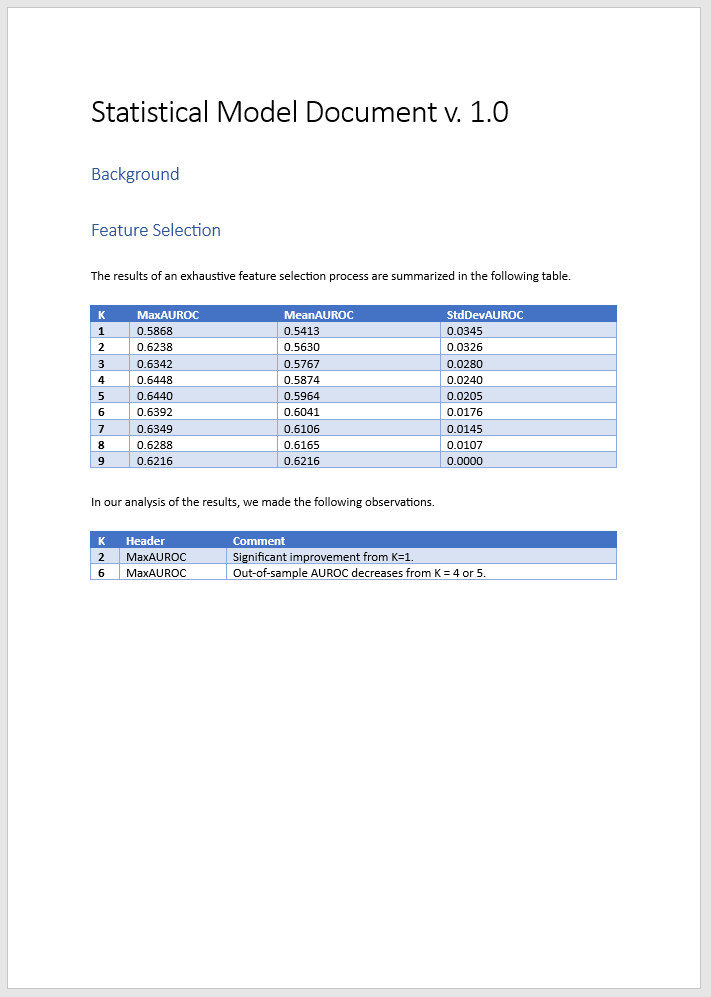
The table shows you the maximal achieved in-sample and out-of-sample AUROCs, along with the mean and standard deviation for each trial. You see that in-sample metrics are broadly increasing with the number of predictors, as expected, whereas out-of-sample AUROC decreases for large values of K as the model becomes overfitted.
The final column in the table shows the value of the AUROC metric for the last K-element predictor set. This kind of metric is useful for trials that estimate some parameter with increasing accuracy.
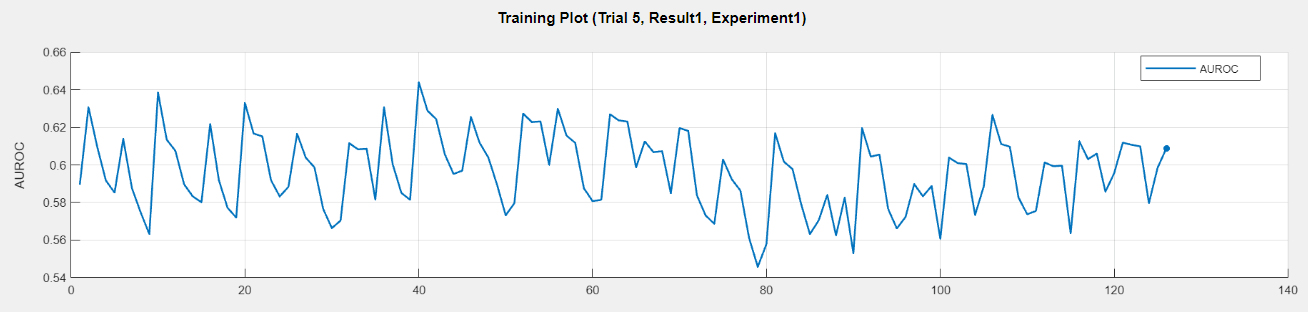
Click Training Plot in Experiment Manager to show how the metric varies over the K-element subsets, as shown here for the fifth trial.
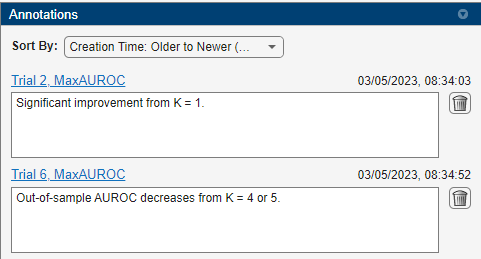
You can add annotations to the summary table by right-clicking any cell.
Document with Modelscape Reporting
To record your findings in model documentation, use Modelscape Reporting. Use the fillReportFromWorkspace function to include development artifacts, such as tables in Microsoft Word documents. For more information, see Model Documentation in Modelscape.
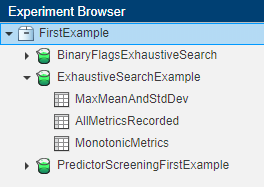
You can extract the summary table and the annotations from the Experiment Manager outputs and insert them in documents using fillReportFromWorkspace. You must specify the name of the experiment and a set of results, which you can find in the Experiment Browser pane of Experiment Manager.
In this figure, FirstExample is the name of the project, ExhaustiveSearchExample is the name of the experiment, and MaxMeanAndStdDev is name of the set of results. You can rename the experiment and the results by right-clicking on these names.
Use the extractExperimentResults example function from the Modelscape support package in either Live Script or Command Window to extract the summary table and the annotations. Run this function in the root folder of the project, or use the ProjectFolder argument to point to the correct location.
[results,annotations] = extractExperimentResults("ExhaustiveSearchExample","MaxMeanAndStdDev")
Save a Word document titled ExhaustiveDocExample.mlx in the project folder and create in it placeholders titled FSSummary and FSDetails. Store columns from the results and annotations tables into variables whose names match these placeholder titles.
FSSummary = results(:,["K","MaxAUROC","MeanAUROC","StdDevAUROC"]);
FSDetails = annotations(:,["K","Header","Comment"]);
Push these tables to the model document.
previewDocument = fillReportFromWorkspace("ExhaustiveDocExample.docx");
winopen(previewDocument)