Modeling Satellite Constellations Using Ephemeris Data
This example demonstrates how to add time-stamped ephemeris data for a constellation of 24 satellites (similar to ESA Galileo GNSS constellation) to a satellite scenario for access analysis. The example uses data generated by the Aerospace Blockset™ Orbit Propagator block. For more information, see the Aerospace Blockset example Constellation Modeling with the Orbit Propagator Block.
The satelliteScenario object supports loading previously generated, time-stamped satellite ephemeris data into a scenario from a timeseries or timetable object. An ephemeris is a table containing position (and optionally velocity) state information of a satellite during a given period of time. Ephemeris data used to add satellites to the scenario object is interpolated via the makima interpolation method to align with the scenario time steps. This allows you to incorporate data generated by a Simulink® model into either a new or existing satelliteScenario.
This example requires Aerospace Toolbox or Satellite Communications Toolbox to run.
Define Mission Parameters and Constellation Initial Conditions
Specify a start date and duration for the mission. This example uses MATLAB® structures to organize mission data. These structures make accessing data later in the example more intuitive. They also help declutter the global base workspace.
mission.StartDate = datetime(2020, 11, 30, 22, 23, 24);
mission.Duration  = hours(24);
The constellation in this example is a Walker-Delta constellation modeled similar to Galileo, the European GNSS (global navigation satellite system) constellation. The constellation consists of 24 satellites in medium Earth orbit (MEO). The satellites' Keplerian orbital elements at the mission start date epoch are:
mission.ConstellationDefinition = table( ...
    29599.8e3 * ones(24,1), ...                % Semi-major axis (m)
    0.0005    * ones(24,1), ...                % Eccentricity
    56        * ones(24,1), ...                % Inclination (deg)
    350       * ones(24,1), ...                % Right ascension of the ascending node (deg)
    sort(repmat([0 120 240], 1,8))', ...       % Argument of periapsis (deg)
    [0:45:315, 15:45:330, 30:45:345]', ...     % True anomaly (deg)
    'VariableNames', ["a (m)", "e", "i (deg)", ...
    "Ω (deg)", "ω (deg)", "ν (deg)"]);
mission.ConstellationDefinition
ans=24×6 table
     a (m)        e       i (deg)    Ω (deg)    ω (deg)    ν (deg)
    ________    ______    _______    _______    _______    _______

    2.96e+07    0.0005      56         350          0          0
    2.96e+07    0.0005      56         350          0         45
    2.96e+07    0.0005      56         350          0         90
    2.96e+07    0.0005      56         350          0        135
    2.96e+07    0.0005      56         350          0        180
    2.96e+07    0.0005      56         350          0        225
    2.96e+07    0.0005      56         350          0        270
    2.96e+07    0.0005      56         350          0        315
    2.96e+07    0.0005      56         350        120         15
    2.96e+07    0.0005      56         350        120         60
    2.96e+07    0.0005      56         350        120        105
    2.96e+07    0.0005      56         350        120        150
    2.96e+07    0.0005      56         350        120        195
    2.96e+07    0.0005      56         350        120        240
    2.96e+07    0.0005      56         350        120        285
    2.96e+07    0.0005      56         350        120        330
      ⋮
Load Ephemeris Timeseries Data
The timeseries objects contain position and velocity data for all 24 satellites in the constellation. The data is referenced in the International Terrestrial Reference frame (ITRF), which is an Earth-centered Earth-fixed (ECEF) coordinate system. The data was generated using the Aerospace Blockset Orbit Propagator block. For more information, see the Aerospace Blockset example Constellation Modeling with the Orbit Propagator Block.
mission.Ephemeris = load("SatelliteScenarioEphemerisData.mat", "TimeseriesPosITRF", "TimeseriesVelITRF");
mission.Ephemeris.TimeseriesPosITRF
  timeseries

  Common Properties:
            Name: ''
            Time: [57x1 double]
        TimeInfo: [1x1 tsdata.timemetadata]
            Data: [24x3x57 double]
        DataInfo: [1x1 tsdata.datametadata]

  More properties, Methods
mission.Ephemeris.TimeseriesVelITRF
  timeseries

  Common Properties:
            Name: ''
            Time: [57x1 double]
        TimeInfo: [1x1 tsdata.timemetadata]
            Data: [24x3x57 double]
        DataInfo: [1x1 tsdata.datametadata]

  More properties, Methods
Load the Satellite Ephemerides into a satelliteScenario Object
Create a satellite scenario object for the analysis.
scenario = satelliteScenario(mission.StartDate, mission.StartDate + hours(24), 60);
Use the satellite method to add all 24 satellites to the satellite scenario from the ECEF position and velocity timeseries objects. This example uses position and velocity information; however satellites can also be added from position data only and velocity states are then estimated. Available coordinate frames for Name-Value pair CoordinateFrame are "ECEF", "Inertial", and "Geographic". If the timeseries object contains a value for ts.TimeInfo.StartDate, the method uses that value as the epoch for the timeseries object. If no StartDate is defined, the method uses the scenario start date by default.
sat = satellite(scenario, mission.Ephemeris.TimeseriesPosITRF, mission.Ephemeris.TimeseriesVelITRF, ...
CoordinateFrame="ecef", Name="GALILEO " + (1:24))
sat =
  1x24 Satellite array with properties:

    Name
    ID
    ImpulsiveManeuvers
    PhysicalProperties
    ConicalSensors
    Gimbals
    Transmitters
    Receivers
    Accesses
    Eclipse
    GroundTrack
    Orbit
    CoordinateAxes
    OrbitPropagator
    MarkerColor
    MarkerSize
    ShowLabel
    LabelFontColor
    LabelFontSize
    Visual3DModel
    Visual3DModelScale
disp(scenario)
  satelliteScenario with properties:

             StartTime: 30-Nov-2020 22:23:24
              StopTime: 01-Dec-2020 22:23:24
            SampleTime: 60
          AutoSimulate: 1
    CentralBodyOptions: [1×1 Aero.satellitescenario.CentralBodyOptions]
            Satellites: [1×24 matlabshared.satellitescenario.Satellite]
        GroundStations: [1×0 matlabshared.satellitescenario.GroundStation]
             Platforms: [1×0 matlabshared.satellitescenario.Platform]
               Viewers: [0×0 matlabshared.satellitescenario.Viewer]
              AutoShow: 1
Alternatively, satellites can also be added as ephemerides to the satellite scenario as a MATLAB timetable, table, or tscollection. For example, a timetable containing the first 3 satellites of the position timeseries object in the previous section, formatted for use with satelliteScenario objects is shown below.
Satellites are represented by variables (column headers).
Each row contains a position vector associated with the row's
Timeproperty.
timetable(...
datetime(getabstime(mission.Ephemeris.TimeseriesPosITRF), Locale="en_US"), ...
squeeze(mission.Ephemeris.TimeseriesPosITRF.Data(1,:,:))', ...
squeeze(mission.Ephemeris.TimeseriesPosITRF.Data(2,:,:))', ...
squeeze(mission.Ephemeris.TimeseriesPosITRF.Data(3,:,:))',...
VariableNames=["Satellite_1", "Satellite_2", "Satellite_3"])
ans=57×3 timetable
            Time                          Satellite_1                                 Satellite_2                                 Satellite_3
    ____________________    ________________________________________    ________________________________________    ________________________________________

    30-Nov-2020 22:23:24    1.8249e+07    -2.2904e+07    -4.2009e+06    2.3678e+07     -1.075e+07     1.4119e+07    1.5239e+07     7.7076e+06     2.4177e+07
    30-Nov-2020 22:23:38    1.8252e+07    -2.2909e+07    -4.1563e+06    2.3662e+07    -1.0735e+07     1.4156e+07    1.5214e+07     7.7334e+06     2.4184e+07
    30-Nov-2020 22:24:53    1.8268e+07    -2.2937e+07     -3.933e+06    2.3584e+07    -1.0663e+07      1.434e+07    1.5088e+07     7.8627e+06     2.4222e+07
    30-Nov-2020 22:31:05    1.8326e+07    -2.3055e+07    -2.8121e+06    2.3185e+07     -1.028e+07     1.5243e+07    1.4466e+07     8.5229e+06     2.4378e+07
    30-Nov-2020 22:48:39    1.8326e+07    -2.3223e+07     3.9182e+05    2.2005e+07    -8.9966e+06     1.7621e+07    1.2798e+07     1.0506e+07     2.4539e+07
    30-Nov-2020 23:08:30    1.8076e+07    -2.3078e+07     3.9992e+06    2.0643e+07    -7.2057e+06     1.9943e+07    1.1124e+07     1.2894e+07     2.4217e+07
    30-Nov-2020 23:28:27    1.7624e+07    -2.2538e+07     7.5358e+06    1.9321e+07    -5.0678e+06     2.1838e+07    9.7076e+06     1.5379e+07     2.3362e+07
    30-Nov-2020 23:50:59    1.6968e+07    -2.1428e+07     1.1328e+07    1.7977e+07    -2.3021e+06       2.34e+07    8.4636e+06     1.8183e+07     2.1782e+07
    01-Dec-2020 00:14:27    1.6244e+07    -1.9712e+07     1.4937e+07    1.6838e+07     8.7771e+05     2.4329e+07    7.5789e+06     2.0966e+07     1.9489e+07
    01-Dec-2020 00:38:42    1.5585e+07    -1.7375e+07     1.8189e+07    1.6017e+07      4.355e+06     2.4512e+07    7.0779e+06     2.3551e+07     1.6498e+07
    01-Dec-2020 01:04:35    1.5124e+07    -1.4345e+07     2.1006e+07    1.5585e+07     8.1065e+06      2.383e+07    6.9314e+06     2.5831e+07     1.2718e+07
    01-Dec-2020 01:31:17    1.5035e+07     -1.079e+07     2.3096e+07     1.562e+07     1.1816e+07     2.2205e+07    7.0715e+06     2.7527e+07     8.3282e+06
    01-Dec-2020 01:58:58    1.5443e+07    -6.8501e+06     2.4303e+07    1.6102e+07     1.5274e+07     1.9601e+07     7.348e+06     2.8484e+07     3.4363e+06
    01-Dec-2020 02:27:08    1.6406e+07    -2.8152e+06     2.4478e+07    1.6925e+07     1.8197e+07     1.6103e+07    7.5521e+06     2.8587e+07    -1.6897e+06
    01-Dec-2020 02:55:18    1.7869e+07      1.001e+06     2.3582e+07    1.7894e+07     2.0376e+07     1.1901e+07    7.4614e+06     2.7856e+07    -6.7427e+06
    01-Dec-2020 03:23:29    1.9711e+07      4.381e+06     2.1653e+07    1.8787e+07     2.1739e+07     7.1754e+06    6.8858e+06     2.6405e+07    -1.1504e+07
      ⋮
Set Graphical Properties on the Satellites
Set satellite in the same orbital plane to have the same orbit color.
set(sat(1:8), MarkerColor="#FF6929");
set(sat(9:16), MarkerColor="#139FFF");
set(sat(17:24), MarkerColor="#64D413");
orbit = [sat(:).Orbit];
set(orbit(1:8), LineColor="#FF6929");
set(orbit(9:16), LineColor="#139FFF");
set(orbit(17:24), LineColor="#64D413");
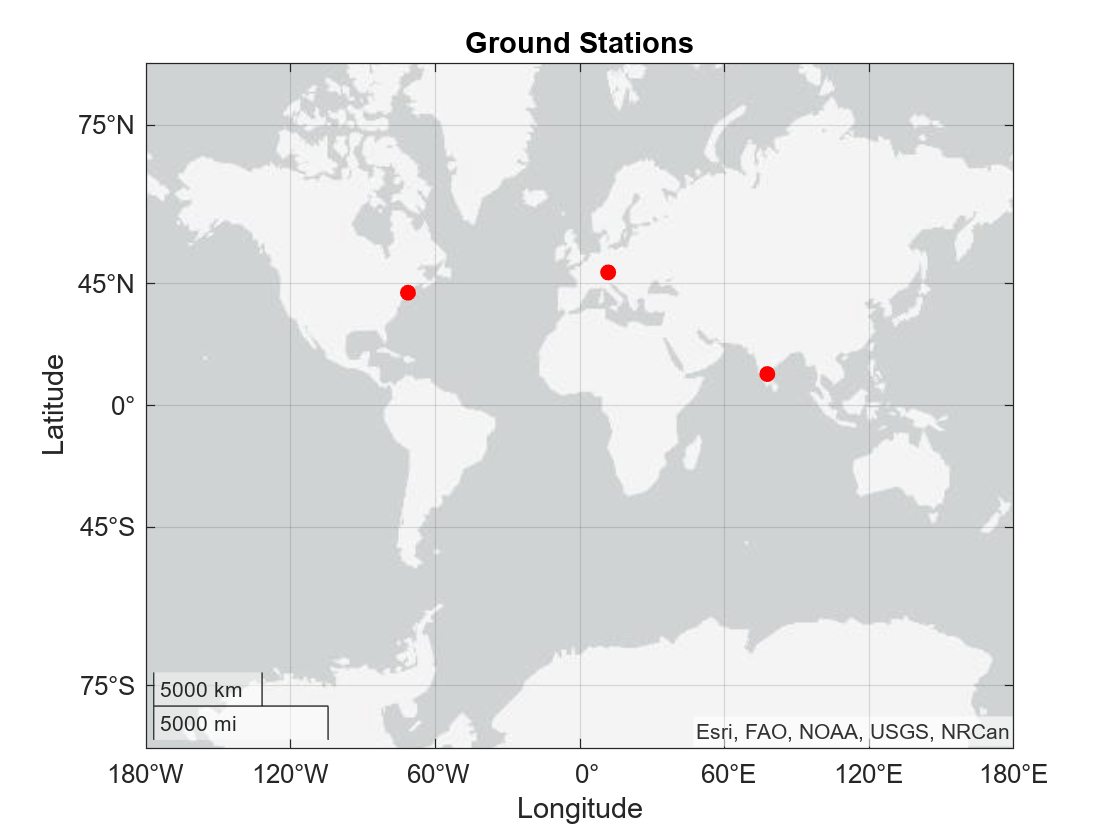
Add Ground Stations to Scenario
To provide accurate positioning data, a location on Earth must have access to at least 4 satellites in the constellation at any given time. In this example, use three locations to compare total constellation access over the 1 day analysis window to different regions of Earth:
Natick, Massachusetts, USA (42.30048°, -71.34908°)
München, Germany (48.23206°, 11.68445°)
Bangalore, India (12.94448°, 77.69256°)
gsUS = groundStation(scenario, 42.30048, -71.34908, ...
    MinElevationAngle=10, Name="Natick");
gsUS.MarkerColor = "red";
gsDE = groundStation(scenario, 48.23206, 11.68445, ...
    MinElevationAngle=10, Name="Munchen");
gsDE.MarkerColor = "red";
gsIN = groundStation(scenario, 12.94448, 77.69256, ...
    MinElevationAngle=10, Name="Bangalore");
gsIN.MarkerColor = "red";

figure
geoscatter([gsUS.Latitude gsDE.Latitude gsIN.Latitude], ...
[gsUS.Longitude gsDE.Longitude gsIN.Longitude], "red", "filled")
geolimits([-75 75], [-180 180])
title("Ground Stations")
Compute Ground Station to Satellite Access (Line-of-Sight Visibility)
Calculate line-of-sight access between the ground stations and each individual satellite using the access method.
accessUS = access(gsUS, sat);
accessDE = access(gsDE, sat);
accessIN = access(gsIN, sat);
Set access colors to match orbital plane colors assigned earlier in the example.
set(accessUS, LineWidth="1");
set(accessUS(1:8), LineColor="#FF6929");
set(accessUS(9:16), LineColor="#139FFF");
set(accessUS(17:24), LineColor="#64D413");

set(accessDE, LineWidth="1");
set(accessDE(1:8), LineColor="#FF6929");
set(accessDE(9:16), LineColor="#139FFF");
set(accessDE(17:24), LineColor="#64D413");

set(accessIN, LineWidth="1");
set(accessIN(1:8), LineColor="#FF6929");
set(accessIN(9:16), LineColor="#139FFF");
set(accessIN(17:24), LineColor="#64D413");
View the full access table between each ground station and all satellites in the constellation as tables. Sort the access intervals by interval start time. Satellites added from ephemeris data do not display values for StartOrbit and EndOrbit.
intervalsUS = accessIntervals(accessUS);
intervalsUS = sortrows(intervalsUS, "StartTime", "ascend")
intervalsUS=40×8 table
     Source        Target       IntervalNumber         StartTime                EndTime           Duration    StartOrbit    EndOrbit
    ________    ____________    ______________    ____________________    ____________________    ________    __________    ________

    "Natick"    "GALILEO 1"           1           30-Nov-2020 22:23:24    01-Dec-2020 04:04:24     20460         NaN          NaN
    "Natick"    "GALILEO 2"           1           30-Nov-2020 22:23:24    01-Dec-2020 01:24:24     10860         NaN          NaN
    "Natick"    "GALILEO 3"           1           30-Nov-2020 22:23:24    30-Nov-2020 22:57:24      2040         NaN          NaN
    "Natick"    "GALILEO 12"          1           30-Nov-2020 22:23:24    01-Dec-2020 00:00:24      5820         NaN          NaN
    "Natick"    "GALILEO 13"          1           30-Nov-2020 22:23:24    30-Nov-2020 23:05:24      2520         NaN          NaN
    "Natick"    "GALILEO 18"          1           30-Nov-2020 22:23:24    01-Dec-2020 04:00:24     20220         NaN          NaN
    "Natick"    "GALILEO 19"          1           30-Nov-2020 22:23:24    01-Dec-2020 01:42:24     11940         NaN          NaN
    "Natick"    "GALILEO 20"          1           30-Nov-2020 22:23:24    30-Nov-2020 22:46:24      1380         NaN          NaN
    "Natick"    "GALILEO 11"          1           30-Nov-2020 22:25:24    01-Dec-2020 00:18:24      6780         NaN          NaN
    "Natick"    "GALILEO 17"          1           30-Nov-2020 22:50:24    01-Dec-2020 05:50:24     25200         NaN          NaN
    "Natick"    "GALILEO 8"           1           30-Nov-2020 23:20:24    01-Dec-2020 07:09:24     28140         NaN          NaN
    "Natick"    "GALILEO 7"           1           01-Dec-2020 01:26:24    01-Dec-2020 10:00:24     30840         NaN          NaN
    "Natick"    "GALILEO 24"          1           01-Dec-2020 01:40:24    01-Dec-2020 07:12:24     19920         NaN          NaN
    "Natick"    "GALILEO 14"          1           01-Dec-2020 03:56:24    01-Dec-2020 07:15:24     11940         NaN          NaN
    "Natick"    "GALILEO 6"           1           01-Dec-2020 04:05:24    01-Dec-2020 12:14:24     29340         NaN          NaN
    "Natick"    "GALILEO 23"          1           01-Dec-2020 04:10:24    01-Dec-2020 08:03:24     13980         NaN          NaN
      ⋮
intervalsDE = accessIntervals(accessDE);
intervalsDE = sortrows(intervalsDE, "StartTime", "ascend")
intervalsDE=40×8 table
     Source         Target       IntervalNumber         StartTime                EndTime           Duration    StartOrbit    EndOrbit
    _________    ____________    ______________    ____________________    ____________________    ________    __________    ________

    "Munchen"    "GALILEO 2"           1           30-Nov-2020 22:23:24    01-Dec-2020 04:34:24     22260         NaN          NaN
    "Munchen"    "GALILEO 3"           1           30-Nov-2020 22:23:24    01-Dec-2020 01:58:24     12900         NaN          NaN
    "Munchen"    "GALILEO 4"           1           30-Nov-2020 22:23:24    30-Nov-2020 23:05:24      2520         NaN          NaN
    "Munchen"    "GALILEO 10"          1           30-Nov-2020 22:23:24    30-Nov-2020 23:58:24      5700         NaN          NaN
    "Munchen"    "GALILEO 19"          1           30-Nov-2020 22:23:24    01-Dec-2020 01:36:24     11580         NaN          NaN
    "Munchen"    "GALILEO 20"          1           30-Nov-2020 22:23:24    01-Dec-2020 00:15:24      6720         NaN          NaN
    "Munchen"    "GALILEO 21"          1           30-Nov-2020 22:23:24    30-Nov-2020 22:28:24       300         NaN          NaN
    "Munchen"    "GALILEO 9"           1           30-Nov-2020 22:34:24    01-Dec-2020 02:22:24     13680         NaN          NaN
    "Munchen"    "GALILEO 18"          1           30-Nov-2020 22:41:24    01-Dec-2020 02:31:24     13800         NaN          NaN
    "Munchen"    "GALILEO 1"           1           30-Nov-2020 23:05:24    01-Dec-2020 06:42:24     27420         NaN          NaN
    "Munchen"    "GALILEO 16"          1           30-Nov-2020 23:29:24    01-Dec-2020 04:47:24     19080         NaN          NaN
    "Munchen"    "GALILEO 15"          1           01-Dec-2020 00:50:24    01-Dec-2020 07:27:24     23820         NaN          NaN
    "Munchen"    "GALILEO 17"          1           01-Dec-2020 01:05:24    01-Dec-2020 03:00:24      6900         NaN          NaN
    "Munchen"    "GALILEO 8"           1           01-Dec-2020 01:57:24    01-Dec-2020 08:25:24     23280         NaN          NaN
    "Munchen"    "GALILEO 14"          1           01-Dec-2020 02:36:24    01-Dec-2020 10:19:24     27780         NaN          NaN
    "Munchen"    "GALILEO 7"           1           01-Dec-2020 04:35:24    01-Dec-2020 09:43:24     18480         NaN          NaN
      ⋮
intervalsIN = accessIntervals(accessIN);
intervalsIN = sortrows(intervalsIN, "StartTime", "ascend")
intervalsIN=31×8 table
      Source          Target       IntervalNumber         StartTime                EndTime           Duration    StartOrbit    EndOrbit
    ___________    ____________    ______________    ____________________    ____________________    ________    __________    ________

    "Bangalore"    "GALILEO 3"           1           30-Nov-2020 22:23:24    01-Dec-2020 05:12:24     24540         NaN          NaN
    "Bangalore"    "GALILEO 4"           1           30-Nov-2020 22:23:24    01-Dec-2020 02:59:24     16560         NaN          NaN
    "Bangalore"    "GALILEO 5"           1           30-Nov-2020 22:23:24    01-Dec-2020 00:22:24      7140         NaN          NaN
    "Bangalore"    "GALILEO 9"           1           30-Nov-2020 22:23:24    01-Dec-2020 03:37:24     18840         NaN          NaN
    "Bangalore"    "GALILEO 10"          1           30-Nov-2020 22:23:24    01-Dec-2020 00:09:24      6360         NaN          NaN
    "Bangalore"    "GALILEO 16"          1           30-Nov-2020 22:23:24    01-Dec-2020 08:44:24     37260         NaN          NaN
    "Bangalore"    "GALILEO 21"          1           30-Nov-2020 22:23:24    30-Nov-2020 23:25:24      3720         NaN          NaN
    "Bangalore"    "GALILEO 22"          1           30-Nov-2020 22:23:24    30-Nov-2020 22:58:24      2100         NaN          NaN
    "Bangalore"    "GALILEO 15"          1           01-Dec-2020 00:17:24    01-Dec-2020 11:16:24     39540         NaN          NaN
    "Bangalore"    "GALILEO 2"           1           01-Dec-2020 00:25:24    01-Dec-2020 07:10:24     24300         NaN          NaN
    "Bangalore"    "GALILEO 22"          2           01-Dec-2020 00:48:24    01-Dec-2020 05:50:24     18120         NaN          NaN
    "Bangalore"    "GALILEO 21"          2           01-Dec-2020 01:32:24    01-Dec-2020 08:29:24     25020         NaN          NaN
    "Bangalore"    "GALILEO 1"           1           01-Dec-2020 03:06:24    01-Dec-2020 07:17:24     15060         NaN          NaN
    "Bangalore"    "GALILEO 20"          1           01-Dec-2020 03:36:24    01-Dec-2020 12:38:24     32520         NaN          NaN
    "Bangalore"    "GALILEO 14"          1           01-Dec-2020 05:48:24    01-Dec-2020 13:29:24     27660         NaN          NaN
    "Bangalore"    "GALILEO 19"          1           01-Dec-2020 05:53:24    01-Dec-2020 17:06:24     40380         NaN          NaN
      ⋮
View the Satellite Scenario
Open a 3-D viewer window of the scenario. The viewer window contains all 24 satellites and the three ground stations defined earlier in this example. A line is drawn between each ground station and satellite during their corresponding access intervals. Hide the details of the satellites and ground stations by setting the ShowDetails name-value pair to false. Show satellite orbits and labels for the ground station locations.
viewer3D = satelliteScenarioViewer(scenario, ShowDetails=false);
show(sat.Orbit);
gsUS.ShowLabel = true;
gsUS.LabelFontSize = 11;
gsDE.ShowLabel = true;
gsDE.LabelFontSize = 11;
gsIN.ShowLabel = true;
gsIN.LabelFontSize = 11;

Compare Access Between Ground Stations
Calculate access status between each satellite and ground station using the accessStatus method. Each row of the output array corresponds with a satellite in the constellation. Each column corresponds with time steps in the scenario. A value of True indicates that the satellite can access the aircraft at that specific time sample. The second output of accessStatus contains the time steps of the scenario. Plot cumulative access for each ground station over the one day analysis window.
[statusUS, timeSteps] = accessStatus(accessUS);
statusDE = accessStatus(accessDE);
statusIN = accessStatus(accessIN);

% Sum cumulative access at each timestep
statusUS = sum(statusUS, 1);
statusDE = sum(statusDE, 1);
statusIN = sum(statusIN, 1);

subplot(3,1,1);
stairs(timeSteps, statusUS);
title("Natick to GALILEO")
ylabel("# of satellites")
subplot(3,1,2);
stairs(timeSteps, statusDE);
title("München to GALILEO")
ylabel("# of satellites")
subplot(3,1,3);
stairs(timeSteps, statusIN);
title("Bangalore to GALILEO")
ylabel("# of satellites")

Collect access interval metrics for each ground station in a table for comparison.
statusTable = [table(height(intervalsUS), height(intervalsDE), height(intervalsIN)); ...
    table(sum(intervalsUS.Duration)/3600, sum(intervalsDE.Duration)/3600, sum(intervalsIN.Duration)/3600); ...
    table(mean(intervalsUS.Duration/60), mean(intervalsDE.Duration/60), mean(intervalsIN.Duration/60)); ...
    table(mean(statusUS, 2), mean(statusDE, 2), mean(statusIN, 2)); ...
    table(min(statusUS), min(statusDE), min(statusIN)); ...
    table(max(statusUS), max(statusDE), max(statusIN))];
statusTable.Properties.VariableNames = ["Natick", "München", "Bangalore"];
statusTable.Properties.RowNames = ["Total # of intervals", "Total interval time (hrs)",...
    "Mean interval length (min)", "Mean # of satellites in view", ...
    "Min # of satellites in view", "Max # of satellites in view"];
statusTable
statusTable=6×3 table
                                    Natick    München    Bangalore
                                    ______    _______    _________

    Total # of intervals                40        40          31
    Total interval time (hrs)       167.88    169.95      180.42
    Mean interval length (min)      251.82    254.93      349.19
    Mean # of satellites in view     7.018    7.1041      7.5337
    Min # of satellites in view          5         5           5
    Max # of satellites in view          9        10           9
Walker-Delta constellations like Galileo are evenly distributed across longitudes. Natick and München are located at similar latitudes, and therefore have very similar access characteristics with respect to the constellation. Bangalore is at a latitude closer to the equator. Despite having a lower number of individual access intervals, it has the highest average number of satellites in view, the highest overall interval time, and the longest average interval duration (by about 95 minutes). All locations always have at least 4 satellites in view, as is required for GNSS trilateration.
References
[1] Wertz, James R, David F. Everett, and Jeffery J. Puschell. Space Mission Engineering: The New Smad. Hawthorne, CA: Microcosm Press, 2011. Print.
[2] The European Space Agency: Galileo Facts and Figures. https://www.esa.int/Applications/Navigation/Galileo/Facts_and_figures
See Also
Objects
satelliteScenario|satellite|access|groundStation|satelliteScenarioViewer|conicalSensor|transmitter|receiver
Functions
Topics
- Multi-Hop Satellite Communications Link Between Two Ground Stations
- Satellite Constellation Access to Ground Station
- Comparison of Orbit Propagators
- Estimate GNSS Receiver Position with Simulated Satellite Constellations
- Model, Visualize, and Analyze Satellite Scenario
- Satellite Scenario Key Concepts
- Satellite Scenario Basics