Align Signals Using Cross-Correlation
Many measurements involve data collected asynchronously by multiple sensors. If you want to integrate the signals and study them in tandem, you have to synchronize them. Use xcorr for that purpose.
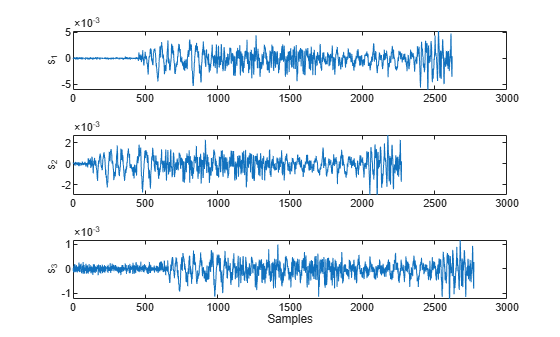
For example, consider a car crossing a bridge. The vibrations it produces are measured by three identical sensors located at different spots. The signals have different arrival times.
Load the signals into the MATLAB® workspace and plot them.
load relatedsig

tiledlayout(3,1)

ax(1) = nexttile;
plot(s1)
ylabel("s_1")

ax(2) = nexttile;
plot(s2)
ylabel("s_2")

ax(3) = nexttile;
plot(s3)
ylabel("s_3")
xlabel("Samples")

linkaxes(ax,"x")
Compute the cross-correlations between the three pairs of signals. Normalize them so their maximum value is 1.
[C21,lag21] = xcorr(s2,s1);
C21 = C21/max(C21);

[C31,lag31] = xcorr(s3,s1);
C31 = C31/max(C31);

[C32,lag32] = xcorr(s3,s2);
C32 = C32/max(C32);
The locations of the maximum values of the cross-correlations indicate time leads or lags.
[M21,I21] = max(C21);
t21 = lag21(I21);

[M31,I31] = max(C31);
t31 = lag31(I31);

[M32,I32] = max(C32);
t32 = lag32(I32);
Plot the cross-correlations. In each plot display the location of the maximum.
tiledlayout(3,1)

nexttile
plot(lag21,C21)
xline(t21,"-","Lag: "+t21,LabelOrientation="horizontal")
ylabel("C_{21}")
title('Cross-Correlations')

nexttile
plot(lag31,C31)
xline(t31,"-","Lag: "+t31,LabelOrientation="horizontal")
ylabel("C_{31}")

nexttile
plot(lag32,C32)
xline(t32,"-","Lag: "+t32,LabelOrientation="horizontal")
ylabel("C_{32}")
xlabel("Samples")
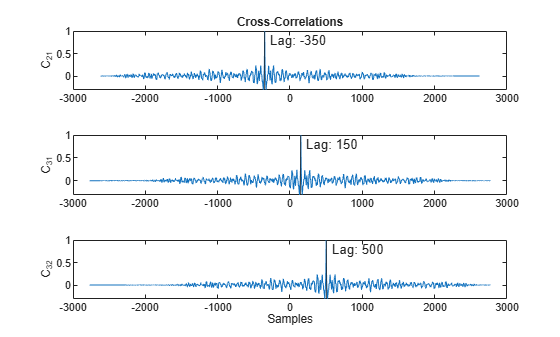
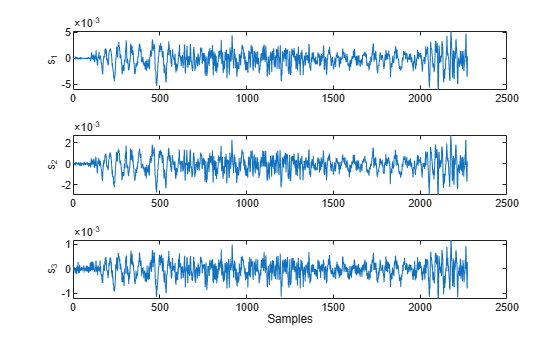
s2 leads s1 by 350 samples; s3 lags s1 by 150 samples. Thus s2 leads s3 by 500 samples. Line up the signals by clipping the vectors with longer delays. The signals are now synchronized and ready for further processing.
s1 = s1(-t21:end);
s3 = s3(t32:end);

tiledlayout(3,1)
ax(1) = nexttile;
plot(s1)
ylabel("s_1")

ax(2) = nexttile;
plot(s2)
ylabel("s_2")

ax(3) = nexttile;
plot(s3)
ylabel("s_3")
xlabel("Samples")

linkaxes(ax,"x")
See Also
alignsignals | finddelay | xcorr