PeakFinderConfiguration
Compute and display the largest calculated peak values on the scope display
Since R2023a
Description
Use the PeakFinderConfiguration object to compute and display
peaks in the scope. The scope computes and displays peaks for only the portion of the input
signal that is currently on display in the scope.
You can specify the number of peaks you want the scope to display, the minimum height
above which you want the scope to detect peaks, the minimum distance between peaks, and label
the peaks. You can control the peak finder settings from the scope toolstrip or from the
command line. The algorithm defines a peak as a local maximum with lower values present on
either side of the peak. It does not consider end points as peaks. For more information on the
algorithm, see the findpeaks (Signal Processing Toolbox) function.
To modify the peak finder settings in the scope interface, click the Measurements tab and enable Peak Finder in the Peaks section. Once you enable the Peak Finder, an arrow appears on the plot at each maxima and a Peaks panel appears at the bottom of the scope window.
The SpectrumAnalyzerBlockConfiguration object supports the
PeakFinderConfiguration object in the command line.
Spectrum Analyzer Toolstrip

Creation
Description
pkfinder = PeakFinderConfiguration() creates a peak finder
configuration object.
Properties
Examples
Open and run the signal amplifier model.
open_system('amplifySigNoise.slx')
sim('amplifySigNoise.slx')
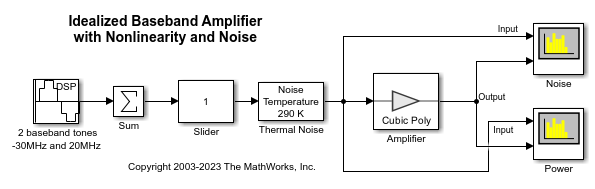
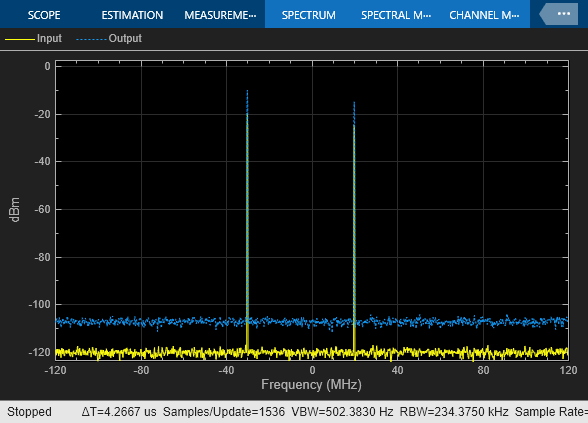
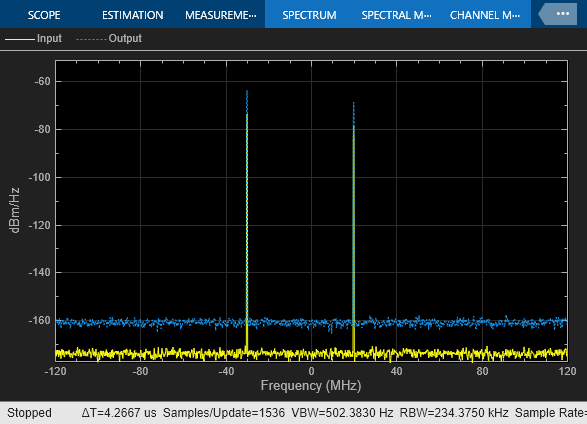
The Spectrum Analyzer blocks in the model show the amplified noise and the signal power plots, respectively. For more details on this model, see the Analysis of Frequency Response of RF System example.
You can obtain or modify the peak, cursor, and distortion measurements in the spectra programmatically by enabling these properties in the SpectrumAnalyzerConfiguration object:
PeakFinderCursorMeasurementsDistortionMeasurements
Access the configuration properties of the Spectrum Analyzer block using the get_param function.
sablockNoise = 'amplifySigNoise/Noise';
cfgNoise = get_param(sablockNoise,'ScopeConfiguration');
sablockPwr = 'amplifySigNoise/Power';
cfgPwr = get_param(sablockPwr,'ScopeConfiguration');
To enable these measurements, set the Enabled property to true.
cfgNoise.CursorMeasurements.Enabled = true;
cfgNoise.PeakFinder.Enabled = true;
cfgNoise.DistortionMeasurements.Enabled = true;
cfgPwr.CursorMeasurements.Enabled = true;
cfgPwr.PeakFinder.Enabled = true;
cfgPwr.DistortionMeasurements.Enabled = true;
You can now modify these measurements programmatically. As an example, display the first two peaks on the spectrum display. By default, the spectrum shows three peaks. To modify the number of peaks it shows, change NumPeaks to 2. You can even label the peaks using the LabelPeaks property and control the minimum distance between adjacent peaks using the MinDistance property. The changes you make to these properties update the spectra accordingly.
cfgNoise.PeakFinder.NumPeaks = 2;
cfgPwr.PeakFinder.NumPeaks = 2;
Version History
Introduced in R2023a