Design PI Controller for DC-DC Converter
R2026bThis example shows how to design a PI controller for a DC-DC converter.
To design the controller using concepts such as gain and phase margin, you need a linearized model. To learn how to linearize models with converters, see Linearize DC-DC Converter Model.
Model Overview
Open the DesignDCDCConverterControl model.
myModel = "DesignDCDCConverterControl";
open_system(myModel);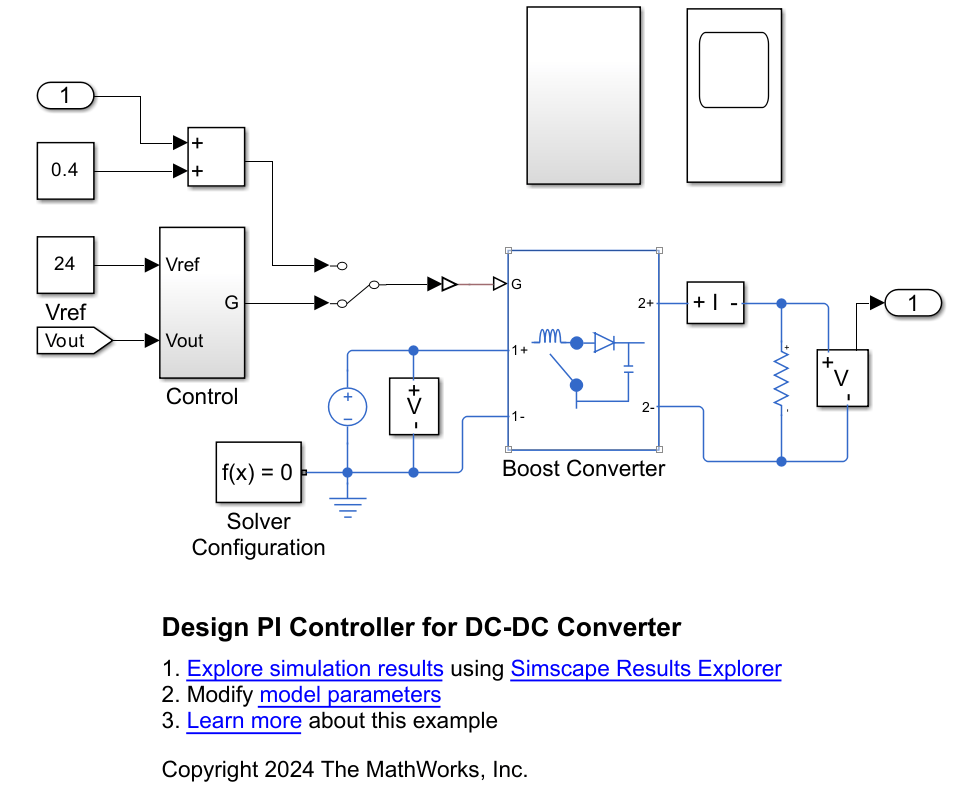
In this example, you model a boost converter using the Boost Converter block. The DC Voltage Source block supplies 12 V to the converter and the Constant or Control block specifies the duty cycle of the pulse-width modulation (PWM) input to the converter. The system can be run using a closed loop control or an open loop duty cycle reference.
Linearize Averaged Switching Model and Plot Frequency Response
Set up the model to allow linearization. Set the model to start from steady state and configure the inputs to run in open loop.
set_param(myModel + "/Solver Configuration",DoDC="on");
set_param(myModel + "/Manual Switch",sw="1");
Linearize the model using the linearize (Simulink Control Design) function. Define input and output analysis points on Simulink signal ports.
io(1) = linio(myModel + "/Manual Switch", 1, "input");
sensingVout = myModel + "/Sensing" + newline + "Vout";
io(2) = linio(sensingVout + "/PS-Simulink" + newline + "Converter4", 1, "output");
G = tf(linearize(myModel, io));
Plot the Bode diagram of the open-loop plant transfer function.
figure; bodeplot(G); grid on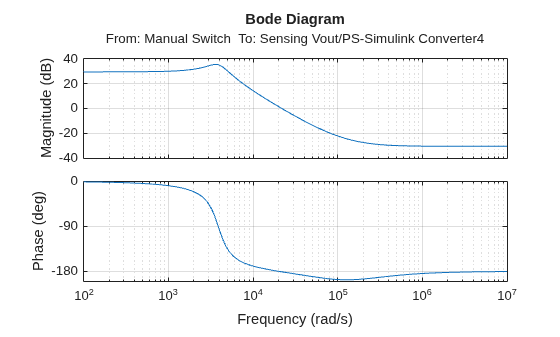
Compute Gain and Phase Margins
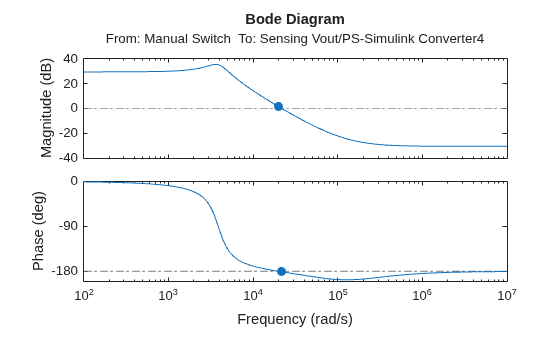
To calculate the phase margin, first obtain the frequency when the gain is 0 dB and calculate the phase at that frequency. To calculate the gain margin, bring the system to the verge of instability, which occurs at a phase angle of .
warnState = warning('off','Control:analysis:MarginUnstable');
[Gm,Pm,Wcg,Wcp] = margin(G);
GmDB = 20*log10(Gm);
Plot the Bode diagram with annotated stability margins.
figure; margin(G)
warning(warnState);
The phase and the gain margin are negative, which tells you that the plant is not stable.
Design Proportional Controller
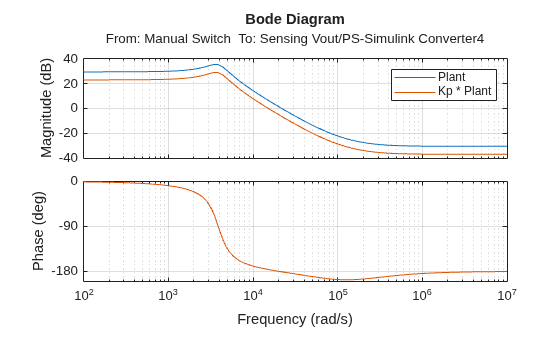
A proportional controller changes the magnitude of the Bode plot but the phase remains the same. A typical gain margin is 5 dB. The gain margin is around -1.5 dB for the converter plant, so the proportional controller must decrease the gain by about 6.5 dB. The controller gain is therefore equal to the inverse of the gain margin plus the plant gain at phase crossover frequency.
Calculate the proportional controller gain.
targetGainMarginDB = 5; % dB
magAtWcg = abs(squeeze(freqresp(G, Wcg)));
kpdB = -(targetGainMarginDB + 20*log10(magAtWcg)); % dB
Kp = 10^(kpdB/20);
Cp = pid(Kp);
Lp = Cp * G;
Plot the new open-loop transfer function with the proportional control.
figure; bodeplot(G, Lp); grid on
legend("Plant","Kp * Plant")
Plot the Bode diagram with the stability margins.
figure; margin(Lp)
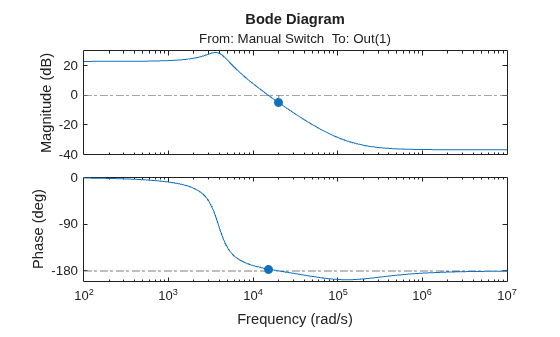
Both the phase and gain margins are positive. To verify that the system is now stable, plot the output voltage of the converter. The plot shows a steady-state error. If you calculate and take a look at the closed-loop transfer function, the order of the numerator and denominator polynomials is the same, which indicates a finite error at steady state for a step input.
plotOutputVoltage("P")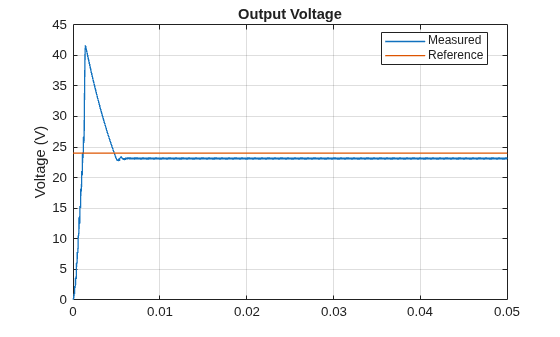
Design a Proportional Integral Controller
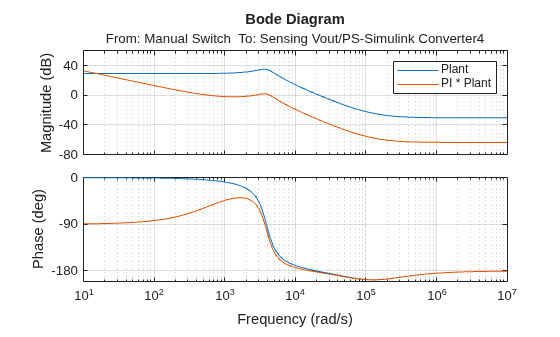
A proportional-integral controller changes both the gain and the phase of the open-loop Bode plot. Choose the gain crossover frequency and phase margin and use pidtune to design the PI controller. A typical phase margin is between 45° and 60°. A crossover frequency of 700 Hz is a sensible value. For the phase margin, choose a value of 55°.
phaseMarginPI = 55; % deg
crossoverFreqPI = 700; % Hz
pulsationPI = crossoverFreqPI*2*pi; % rad/s
Use pidtune to automatically compute the PI controller gains for the desired crossover frequency and phase margin.
opts = pidtuneOptions("PhaseMargin",phaseMarginPI);
Cpi = pidtune(G, "PI", pulsationPI, opts);
Extract controller gains for the model. The PID Controller block uses ideal form , so the integral gain parameter is .
Kp = Cpi.Kp
Kp =
0.0216
I = Cpi.Ki / Cpi.Kp
I =
712.3145
Compute the open-loop transfer function with the PI controller and plot the Bode diagram.
Lpi = Cpi * G;
figure; bodeplot(G, Lpi); grid on
legend("Plant","PI * Plant")
Plot the Bode diagram with annotated stability margins.
figure; margin(Lpi)
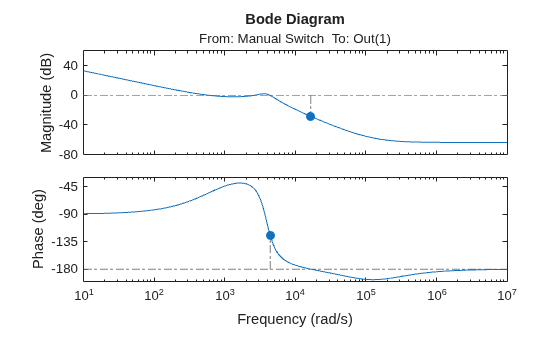
In this example, the gain margin is large enough to make the system controllable. If the gain margin is too small, you can choose different values of the gain crossover frequency and phase margin. The control is now slower due to the integral action, but the steady-state error is zero, and the overshoot is smaller.
plotOutputVoltage("PI")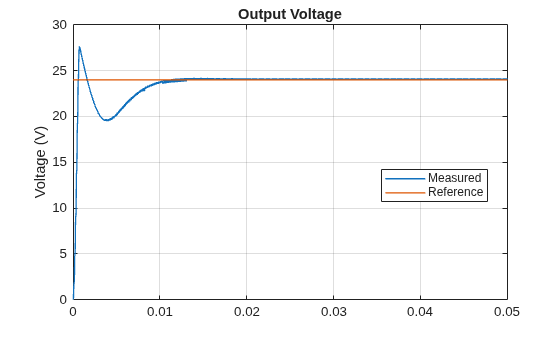
See Also
Simscape Blocks
Functions
linearize(Simulink Control Design) |bodeplot(Control System Toolbox) |pidtune(Control System Toolbox)
Topics
- Linearize DC-DC Converter Model
- Boost Converter Voltage Control
- Design Controller for Boost Converter Model Using Frequency Response Data (Simulink Control Design)
- Design Controller for Power Electronics Model Using Simulated I/O Data (Simulink Control Design)
- Design PID Control for DC Motor Using Classical Control Theory
- Linearize Models with Converters Using Averaged Switching

